This site uses cookies to improve your experience. To help us insure we adhere to various privacy regulations, please select your country/region of residence. If you do not select a country, we will assume you are from the United States. Select your Cookie Settings or view our Privacy Policy and Terms of Use.
Cookie Settings
Cookies and similar technologies are used on this website for proper function of the website, for tracking performance analytics and for marketing purposes. We and some of our third-party providers may use cookie data for various purposes. Please review the cookie settings below and choose your preference.
Used for the proper function of the website
Used for monitoring website traffic and interactions
Cookie Settings
Cookies and similar technologies are used on this website for proper function of the website, for tracking performance analytics and for marketing purposes. We and some of our third-party providers may use cookie data for various purposes. Please review the cookie settings below and choose your preference.
Strictly Necessary: Used for the proper function of the website
Performance/Analytics: Used for monitoring website traffic and interactions
Learn more on how to start the journey through the following infographic below for the proper methodology in finding a perfect audience below: It's time to gain a deeper understanding at the start – once you are attuned to the sensitivities that resonate with your audience, you’ll never see them the same way again.
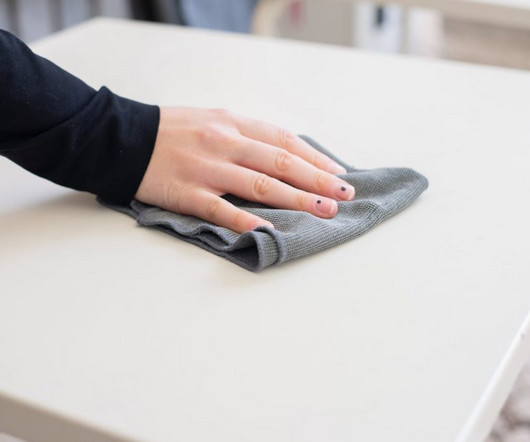
Orkin Canada shared the infographic below to help restaurateurs spot-check key areas of their restaurants for pest activity. As restaurants look to reopen, owners and managers have to deal with enhanced health and safety guidelines, cleanliness protocols and pest control.
The restaurant industry is a hotbed for bacteria, with the potential for contamination lurking around every corner. From the moment a customer steps through the door to the time they leave, they are exposed to a myriad of germs.
To learn more about finding the perfect niche, check out the infographic below. When done right, niche marketing can revolutionize the way you do business. Once you’ve found the right audience of returning customers, your restaurant will inevitably grow.
Check out the following infographic courtesy of Abode HR for some valuable information: This, coupled with the fact that job transitions are up 80% from year to year for Gen Z, it is time to pay close attention. That being said, do you know the differences between Gen Z versus generations past?
Use the infographic below for more tips to drive loyal customers , courtesy of Fundera. When employees are happy, they tend to provide better service. Think about ways to reward your employees for their hard work. Whether that be a free cocktail at the end of a shift or discounts on food items.
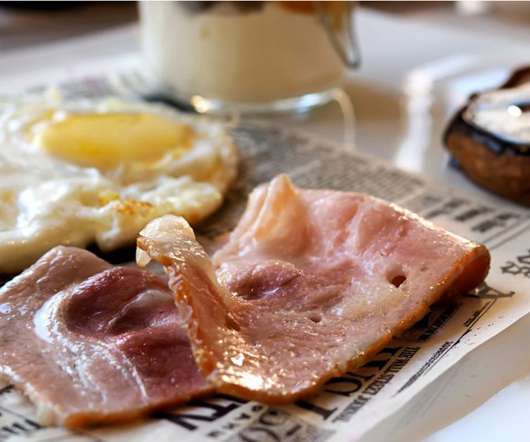
Check out the following infographic from Bob Evans on a study of consumer behavior and attitudinal shifts toward breakfast in the visual deep dive below. This enabled many of us to (attempt) to sleep in and have a more relaxed breakfast. Now that some restrictions have been lifted, why not continue our habit of a better breakfast?
Learn more about innovation in the world of nimble live video in the infographic below: While live video may have had its challenges in the past, technologies are emerging to help change the game for creators and restaurant owners alike.
To help you capitalize on the day, Coupon Chief put together an infographic with fun promotional ideas restaurants can use to attract customers on St. Check out the infographic below for a few ideas. On March 17 this year, millions of Americans will flock to restaurants across the country to celebrate St. Patrick’s Day.
Take a look at the infographic and research below from Wiideman on the best way to get there. Putting together a multi-location landing page strategy to get to the coveted three-pack of local Google search results for your restaurant chain can be a daunting task.
They've created this infographic to outline how COVID-19 has impacted F&B consumer marketing trends. While more Americans are getting vaccinated and states are loosening their lockdown protocols, food and beverage consumers aren't necessarily resuming their former shopping behaviors.
This infographic from the International Fresh Produce Association describes two key functions—tracebacks and recalls—and illustrates their critical differences. Expanding traceability with traceability lot codes can profoundly impact supply chain efficiency and facilitate faster responses to public safety issues.
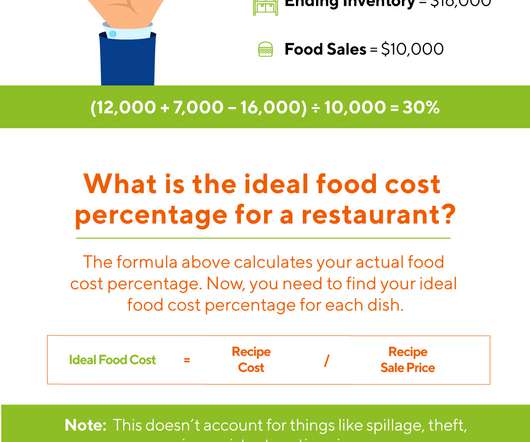
To help you find your food cost percentage and compare it against your prices, check out the infographic below. It’s important that you calculate your food costs. This is typically done as a percentage.
Below you’ll find two infographics that C3 created to illustrate what parents expect from kid-friendly QSRs and kid-friendly casual dining restaurants.
For more tactics on safeguarding food safety during processing, take a look at the accompanying infographic by Key Technology. An easily cleaned kitchen establishes a firm foundation for a sanitary environment.
This infographic further illustrates the industry breakdown, as well as overall loan volume and size by region and state. We found that of all industries we helped generate loans for, the restaurant industry ranked third in volume (behind construction and healthcare) at just over $150 million.
Using aggregated data from 2,000+ restaurant locations running Wisely’s CRM, marketing automation, waitlist, reservations, and sentiment technology—Wisely compiled five counterintuitive insights visualized in the infographic below.
In the infographic below, you will find 14 emergency measures you can implement as a restaurant owner to protect your business and customers during the COVID-19 pandemic. In these times of crisis, some of the few options restaurants have are no-contact delivery and minimum exposure pickup.
There is a science to running a successful business. That idea holds true in the hospitality and food service industries where crucial business decisions are made every day. At the heart of this science is data. Tracked from numerous sources, thoughtful analysis of this data can be the key to prioritizing needs, driving growth and so on.
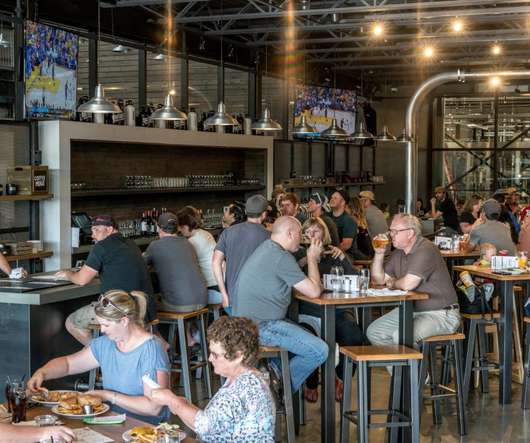
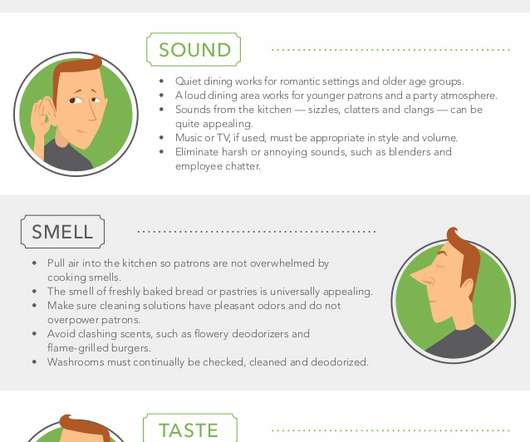
The infographic below, Restaurant Ambience Perfect for the Five Senses, offers useful, practical tips that will help you cover all the sensory bases in your establishment. The infographic is especially helpful because it describes options in such a way that it enables any restaurant to draw the appropriate conclusions.
We developed this infographic to highlight a three-part plan for “Restaurant Recovery” in 2020 and beyond due to COVID-19. These factors require that restaurants utilize a combination of both technology and process, which will allow them to work toward profitability in a socially distanced and contactless world.
Comfort food, outdoor dining, Riesling and streamlined menus were top trends for 2020, according to Kimpton Hotels & Restaurants ' seventh annual Culinary & Cocktail Trend Forecast for 2021.
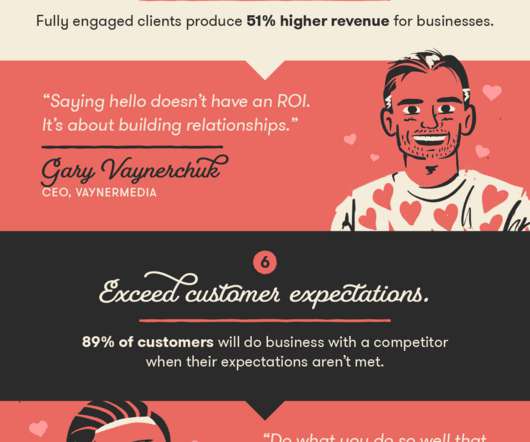
Did you know that nine out of 10 customers are likely to read reviews before they choose a business? That’s why having good online reviews for your restaurant is essential to the bottom line. What about negative feedback? While no one likes to receive criticism or complaints, the fact is that bad reviews could be good news for your business.
Social media platforms, such as Facebook, Instagram, and Pinterest, make it easy to connect with potential customers. And, there are many different channels through which you can communicate with your audience. If you have limited time and money, how do you know which platforms you should be using to promote your restaurant?
the team at 7shifts created an infographic that tells how restaurants have been impacted by COVID-19 as well as indicators of what to expect moving forward. Tapping into its data hub that shows real-time data from more than 350,000 restaurants and restaurant professionals across the US and Canada.,
Bacardi Limited released its third annual Bacardi Cocktail Trends Report , looking ahead at the key trends impacting the business of cocktails in 2022. “As 2022 brings new perspective, people are coming together with a strong desire to ‘Make Moments Matter.
Efficiency is paramount when it comes to your drive-thru service. This crucial aspect significantly influences the financial success of your Quick-Serve Restaurant (QSR) and plays a pivotal role in thriving within a competitive market.
Ninety-eight percent of consumers used digital ordering in some form in the last 18 months and 70 percent prefer to order digitally over in-person, according to results from a customer ordering preferences survey from Koala.
More than 30 QSR brands have nearly three Esports sponsorship deals on average, while 10 have five or more, according to SponsorUnited’s a “ QSR and Esports Sponsorship Snapshot.” ” The report notes that as Esports popularity grows, QSR brands are investing in the space through sponsorships.
When your commercial fridges aren’t operating at full capacity, it has a negative impact on your business. From lost inventory to the increased risk for making customers sick, you need a dependable fridge that will keep your inventory and ingredients fresh.
Why exactly is inflation rising so quickly at the moment? If you’ve been out to the grocery store, restaurant, gas station, or watching the Dollar Store go up to $1.25, it’s hard to miss all of the signs. What can restaurants do to hedge against inflation?
Like any business, you may occasionally have to deal with an unhappy customer. Traditionally, this has meant that the manager comes out and apologizes to the guest, then offers a discount or a comped meal. This system has worked well enough in the past. However, a lot has changed in the last four or five years.
A fraud scheme where cybercriminals leverage the Telegram messaging platform to steal from restaurants and food delivery services was just identified by research and analysis from Sift’s Digital Trust and Safety Architects.
The infographic that follows provides a visual breakdown of the impact of drive-thru speed on your business, along with key statistics and actionable strategies for optimizing your drive-thru operation. By prioritizing efficiency and accuracy in your drive-thru, you can create a win-win situation for both your business and your customers.
According to data revealed in SeeLevel HX's 2020 QSR Drive-Thru Study , there's been a shake-up among restaurants with the fastest total time, which consists of both service times and wait times with KFC taking the lead followed by Taco Bell, Hardee’s, Carl’s Jr., and Burger King.
The restaurant industry has scene a drastic shift in digital transformation in light of the COVID-19 pandemic, according to a Mobiquity's latest survey, " Digital Transformation of Consumer Restaurant Preferences Survey."
As a small business owner, you know how important and impactful it is to support local creators. It could be that one customer or network that helps keep your team’s spirits up and running. With the holiday just around the corner, it may be time to spread kindness throughout your community and other businesses.
Chances are, you've heard the old adage of hire slow, fire fast. Perhaps it originated in the fast-paced restaurant industry in the first place? It's easy to see at such a pace when people just aren't working out.
Running a restaurant can be a rewarding and demanding career. To have a successful restaurant, the owner or manager must be skilled at managing both front-of-house and back-of-house functions.
We all remember the time period when Chipotle repeatedly had one monumental security breach after another. However, data breaches can happen to restaurant chains and small eateries alike. Nearly half of cyber-attacks target small businesses and 60 percent of small companies who experience a significant attack go out of business.
Learn more about healthy eating options during the global pandemic from the infographic below. The good news is that everyone is still going to be able to remain well-fed through this pandemic, and there are plenty of websites that can help people find resources including recipes based on ingredients on hand.
How are consumers feeling about going out to eat as restaurants begin to emerge from the COVID-19 pandemic and open their dining rooms? Measure Protocol , Decode Consulting and Garden Social Beer Garden and Kitchen surveyed American adults in order to find out the answer to this question.
Among the findings: A staggering 91 percent of brand leaders affirm that music can make or break their customer experience 95 percent see music as an equally important brand ambassador, much like their employees 72 percent are facing challenges in implementing a consistent music strategy across different contexts Only 51 percent understand the legality (..)
We organize all of the trending information in your field so you don't have to. Join 49,000+ users and stay up to date on the latest articles your peers are reading.
You know about us, now we want to get to know you!
Let's personalize your content
Let's get even more personalized
We recognize your account from another site in our network, please click 'Send Email' below to continue with verifying your account and setting a password.


Let's personalize your content