Who Benefits from the Restaurant Revitalization Fund?
5 Min Read By Lei Han, Ph.D., CPA
The Restaurant Revitalization Fund (RRF) was established by the American Rescue Plan (ARP) Act of 2021, which was signed into law by President Joe Biden on March 11, 2021, with the intention of helping small to mid-sized businesses in the food service industry, which was hard hit by the COVID-19 pandemic.
The Small Business Administration (SBA hereafter) was charged to administer the $28.6 billion tax-free grant. At the end of April, the SBA launched the registration portal online for RRF. On May 3, when the website officially opened, applications started to pour in and quickly exhausted the funding pool. By the end of June, the SBA received more than 278,000 applications with requests totaling $72.2 billion (SBA, n.d. -a). Only 101,600 lucky applicants received approvals of their requests. On July 2, the SBA administrator Isabel Guzman announced the closure of the RRF program in a press release.
According to the program guidelines (SBA, n.d. -b), the RRF grants can be used for paying for a variety of expenses, including utilities, payrolls, supplies and other qualified costs, and each qualified business can apply for a grant up to $5 million per physical location, but not exceeding $10 million in total for multiple locations.
A week after the program was closed, the SBA publicized the database on the RRF. The remainder of the article will analyze the data to offer some insights on how the fund was divided and who benefit from the grants.
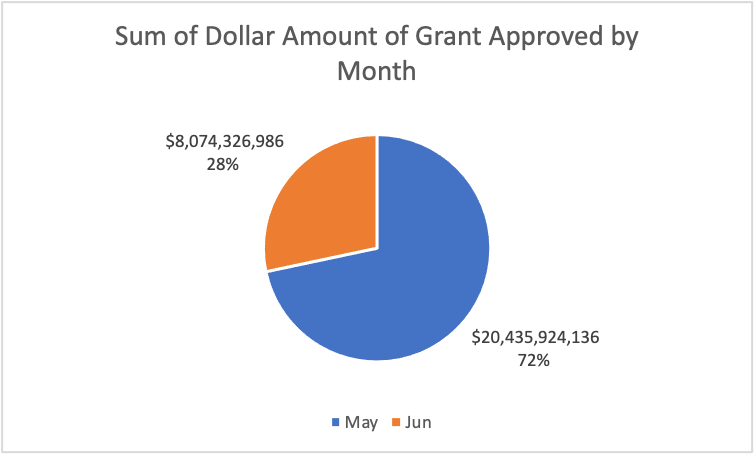
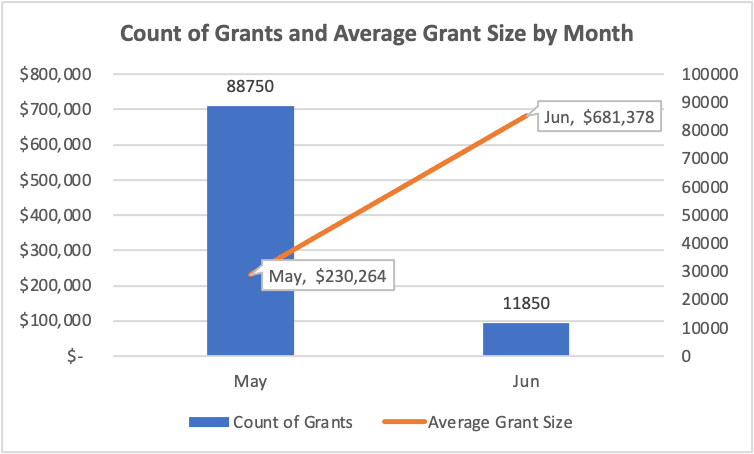
In May 2021, the first month when the fund became available, 88,750 applications valued at approximately $20 billion in total (72 percent of the fund budget) were approved (see Figure 1), indicating that the RRF exhausted very quickly after the program opened. The average size of grants approved in May was $230,264. In June, another 11,850 applications were approved before the rest of the fund ran out. The average size of grants approved in that month was $681, 378 (see Figure 2).
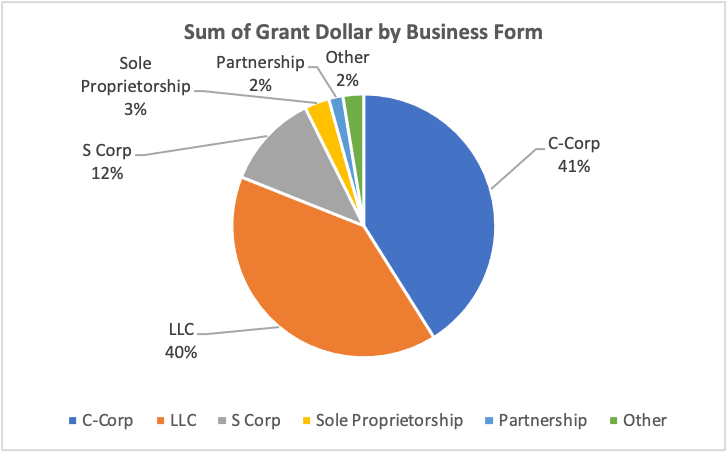
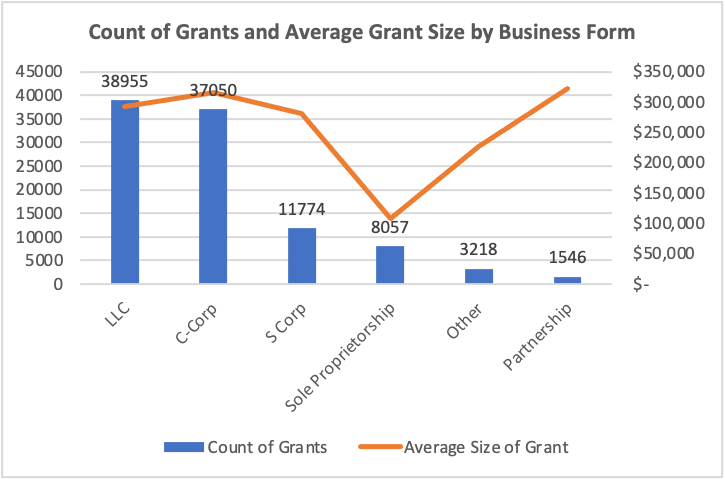
The restaurant applicants are diversified in business forms. Forty-one percent of the fund went to C-Corps, 40 percent LLCs, 12 percent S-Corps, three percent sole-proprietors, two percent partnerships and the remaining two percent to all others, including tribal businesses (see Figure 3). In terms of number of grants, LLCs replaces C-Corps as the largest group with 38,955 approved applications. C-Corps stays closely behind with 37,050 applications approved. Within each business form, the average size of grants is around $300,000, except for sole-proprietors, which have a smaller average size of $107,717 (see Figure 4). This is consistent with the fact that businesses with a sole owner tend to have smaller operations than their peers in the forms like partnership, corporation and LLC.
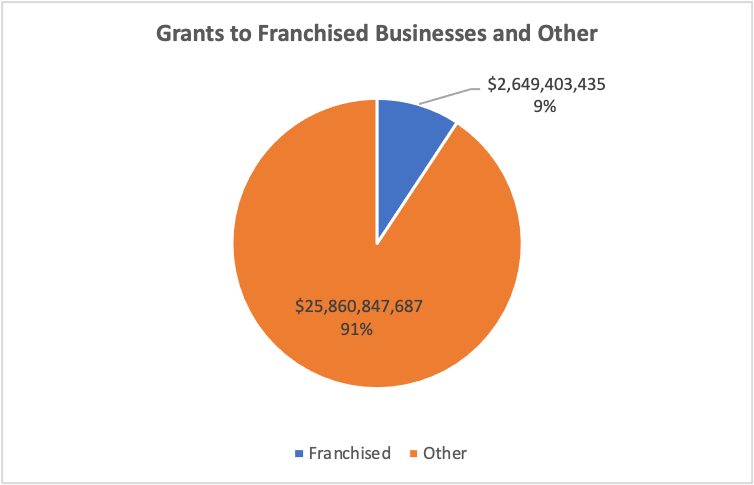
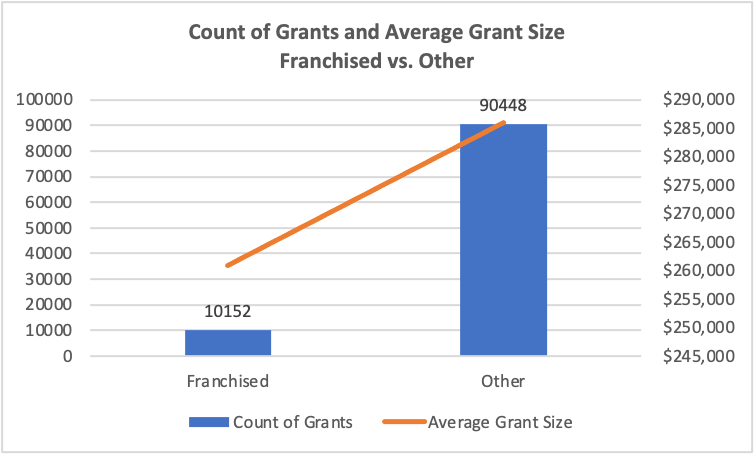
Over 90 percent of the RRF, amounting to approximately $25 billion, was granted to 90,448 non-franchised restaurants, with the remaining nine percent to 10,152 franchised restaurants (see Figures 5 and 6). There is no prominent difference in the average size of grants between franchised and non-franchised businesses, which ranges from $260,000 to $285,000.
For the franchised businesses in the database, all approved RRF grants are subtotaled by named franchise. The top five franchise recipients and their total grants are displayed in Table 1.
|
|
Franchise |
Total Grants |
|
1. |
Subway |
$362,265,927 |
|
2. |
Golden Corral |
$277,112,270 |
|
3. |
IHOP |
$117,944,461 |
|
4. |
Denny’s |
$79,043,758 |
|
5. |
Dunkin’ Donuts |
$63,547,348 |
(Table 1)
The original plan of the program was to offer priority review of applications submitted by businesses owned by women, veterans and socially and economically disadvantaged individuals for the first 21 days of the program (SBA, n.d. -c), or the prioritized group. The policy was challenged by lawsuits claiming that it discriminated businesses of white male owners. The judges ruled in favor of the plaintiffs in those lawsuits, which led to the rescission of thousands of already approved grants to the prioritized group by the SBA (Romeo, 2021).
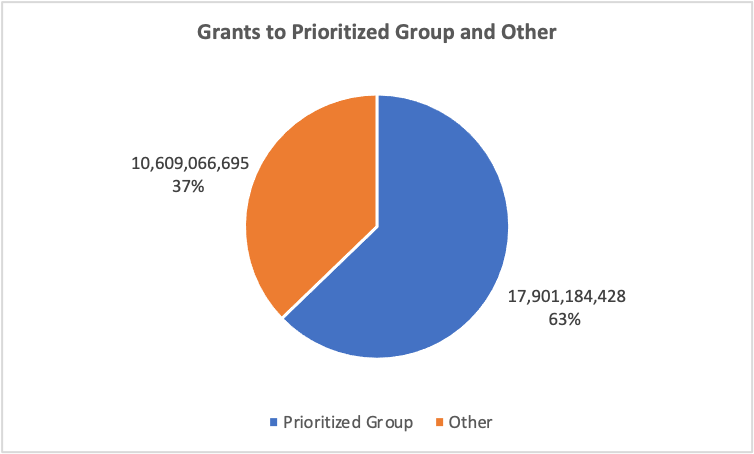
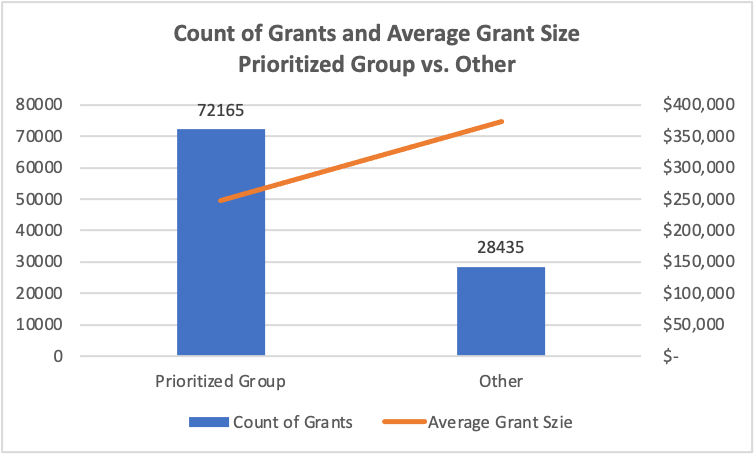
In the end, 63 percent of the fund was granted to 72,165 applicants in the prioritized group, with the rest to 28,435 applicants outside the group (see Figures 7 and 8). The average size of grants to the prioritized group is at around $250,000, much lower than $373, 099 to other businesses.
Across the country, expectedly, larger states/district tend to have more restaurants to apply for the RRF and to eventually get a larger sum of grants state-wide. The top five winners and their total grants are displayed in Table 2.
|
|
State/District |
Total Grants |
|
1. |
California |
$5,703,196,722 |
|
2. |
New York |
$3,663,496,349 |
|
3. |
Texas |
$1,666,190,554 |
|
4. |
Illinois |
$1,415,682,112 |
|
5. |
Florida |
$1,340,899,692 |
In terms of average grant size for each state or district, the top five winners and their average grant sizes are displayed in Table 3. New York and California are again among the top five on this list, which are joined by D. C., Massachusetts and Hawaii. This list could be partially related to the high cost of living of the areas.
|
|
State/District |
Average Grant |
|
1. |
D. C. |
$549,395 |
|
2. |
Massachusetts |
$388,841 |
|
3. |
New York |
$375,666 |
|
4. |
Hawaii |
$361,934 |
|
5. |
California |
$357,478 |
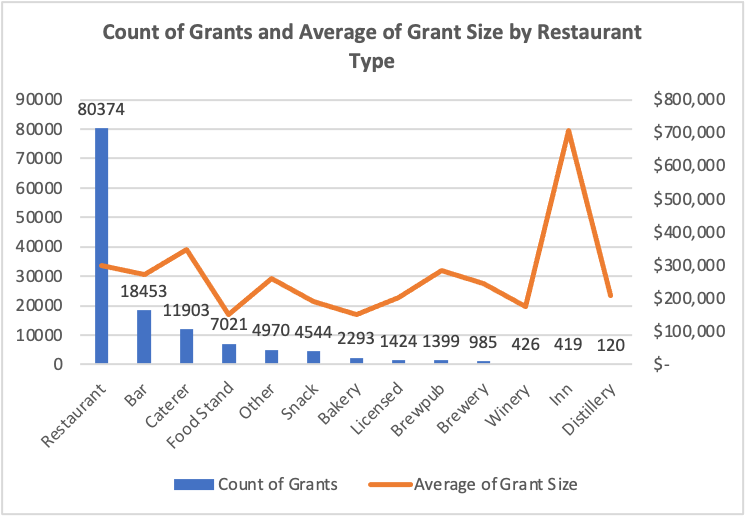
When restaurants are further divided into sub-groups, the data tell a little bit more about the composition of the applicants and the size of grants to each sub-group. Most of the applicants (80,374; 80%) still claimed themselves as a “Restaurant”. However, since a business could make multiple selections when self-disclosing on their applications, the count of grants does not add up exactly as the total count of applicants based on the dataset. For most sub-groups, the average grant size is relatively stable around the range between $150,000 to $300,000. The only exception was for the businesses that claimed themselves as “Inn”, with an average grant size of over $700,000.
To sum up, the RRF ran out quickly after its debut and was far from enough to help revive every restaurant affected by the pandemic. C-corps, S-corps and LLCs were among the top three recipients in terms of both sum of grants and grant size. Over 90 percent of the fund went to support non-franchised restaurants. Over 60 percent of the fund was granted to the prioritized group including restaurants owned by women, veterans and socially and economically disadvantaged individuals. Expectedly, large states tend to get a large cut from the fund, while the average size of individual grants could be reflecting the cost of living of an area.
A house bill was introduced by Congressman Mr. Blumenauer in June, to amend the ARP Act to increase the appropriations to the RRF by $60 billion.
References
Small Business Administration. “SBA Administrator Announces Closure of Restaurant Revitalization Fund Program.” SBA.gov. Accessed July 28, 2021-a.
Small Business Administration. “SBA Restaurant Revitalization Funding Program Guide.” SBA.gov. Accessed July 28, 2021-b.
Small Business Administration. “SBA Restaurant Revitalization Funding.” SBA.gov. Accessed July 28, 2021-c.
https://www.sba.gov/funding-programs/loans/covid-19-relief-options/restaurant-revitalization-fund
Romeo, Peter. “SBA Stops Restaurant Revitalization Fund Payments After Courts Rule They’re Discriminatory.” Restaurantbusinessonline.com. June 14, 2021.