
Restaurant reporting has become a vital tool in an industry that has — for far too long — relied on gut feeling to make business decisions.
Today, restaurant operators and F&B managers like you have access to many reports, primarily thanks to advanced POS systems.
However, while there are certainly many upsides to this digitalisation, reports also come with their own basket of problems. Problems like knowing the what but not the why behind it; non-existent or limited back-of-house visibility; and essential information buried under a mountain of trivia.
Luckily, restaurant data analytics solutions like Apicbase take these problems off your plate.
In this post, you’ll learn how to leverage analytics to get laser-focused insights about your entire operation and individual outlets.
You can use the information here to get started with any restaurant business intelligence and analytics software.
I am also sharing some juicy examples of Apicbase’s new Insights Hub in action, so make sure to check those out.
Here’s what we’ll cover:
- What is restaurant reporting?
- What is restaurant analytics?
- How do they relate to each other?
- What data sources to consider?
- Why is analytics essential in the F&B industry?
- Why combining FoH and BoH data makes analytics more powerful
- Final thoughts
Let’s kick things off by drilling into restaurant reporting… and why reporting ≠ analytics.
What is Restaurant Reporting?
Generally, reporting deals with organising and summarising large quantities of data and presenting them in a digestible, easy-to-understand format — reports.
So raw numbers and jumbled data become information.
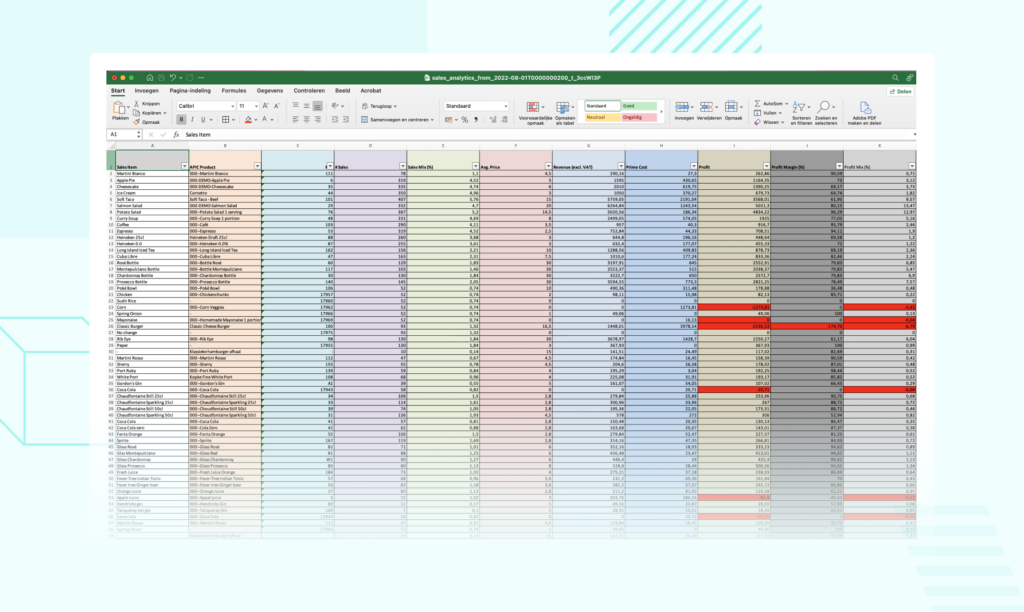
Some POS-side examples include sales, payment, and footfall reports. On the back-of-house side of things, we have inventory, purchasing, and menu profitability reports.
Most operators rely on these reports to get an overview of their operations. They’re almost like a pulse-checking tool that lets you quickly evaluate the health of the business.
But… the problem with reports is that they raise more questions than answers.
They tell you what’s going on with a specific part of your business at a specific time.
What they don’t tell you is the why behind those goings-on.
Looking at a sales report, you might see that your Tuesday sales are lower than average. Or that your high-ticket menu items are flying out of the kitchen on Wednesdays and Thursdays but not on Fridays. Or that your food cost is 32% in this one outlet and 36% in other nearby outlets.
Do you want to know the WHY?
In that case, you’ll need to turn to restaurant analytics.
What is Restaurant Analytics?
Restaurant analytics software combines multiple data sets — sales, staffing, inventory, and others — to dive deeper into the questions raised by canned reports… and to answer those big whys.
If reporting turns data into information, then analytics turns information into insights.
Remember those underperforming Tuesdays?
Your reports will show that your sales are low… but restaurant data analytics might highlight that you only have one prep cook on location on Tuesday mornings. And since your morning best-sellers are pre-made sandwiches and croissants — and you don’t open on Mondays — there’s no way that one prep cook can cope. The solution? Add another prep cook to the staffing rota, and the problem disappears.
Restaurant analytics frames your data within a business-specific context. It gives meaning to abstract numbers, offering insights that drive your operation’s profitability.
Of course, the example above is just the tip of the iceberg.
A continuous restaurant performance analysis slices and dices data from multiple sides. This gives you access to insights that would have otherwise remained hidden. For example, optimising purchasing by considering historical sales data and transfer trends. This ensures low inventory variance and eliminates the cost of frequent outlet-to-outlet transfers. Or highlighting your best vendors for specific ingredient categories. This puts you in a position of power when you’re renegotiating contracts with your suppliers.
How Do Reporting & Analytics Relate?
Just because analytics is a higher-order tool than reporting doesn’t mean that the two are not inseparably connected… or that reporting doesn’t have a place in your operation.
Think of it in terms of this path-to-value diagram:
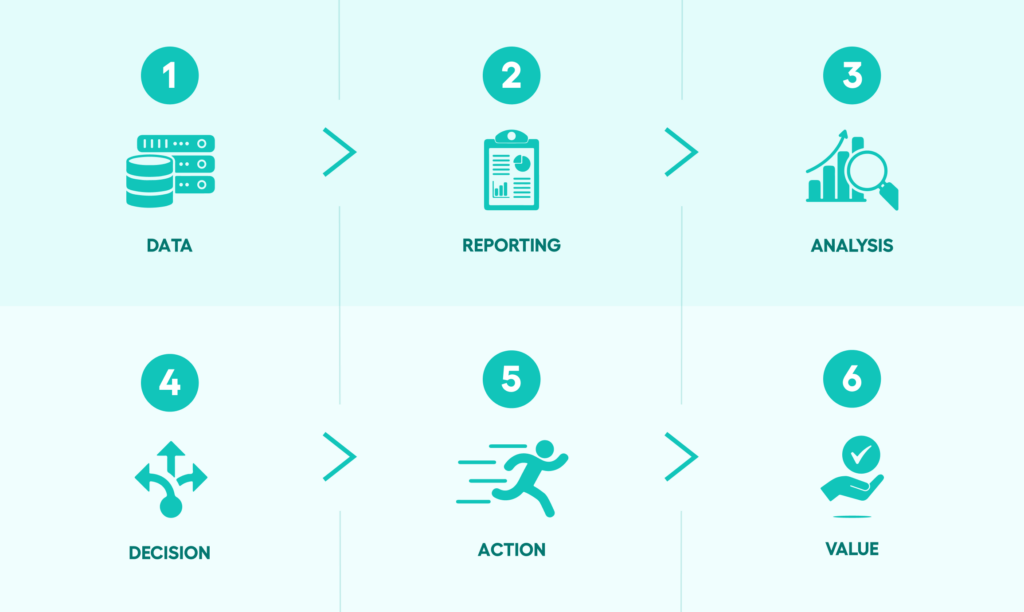
If you remove just one domino from the line-up, the following action can become impossible [or, at least, extremely difficult]. Restaurant analytics tools use your various reports to stitch together the story of your operation. The data is standardised, analysed, and contextualised to provide meaningful business-building insights.
Plus, you’ll still use those reports across your organisation.
If anything, reports make it easier to get an at-a-glance overview of the operation and check key restaurant performance indicators. Executives, boards, and investors love reports. But for in-the-trenches managers who need something to guide their daily (and long-term) decision-making, the real value is in restaurant analytics.
Why Analytics is Essential in the F&B Industry
If staying in control and data-driven decision-making aren’t good enough reasons to start leveraging analytics — although they should be — I’ll be very blunt with the answer.
We’re all in the restaurant business to make a profit.
We can talk about that warm feeling we get when we provide a customer with a one-of-a-kind dining experience until we’re blue in the face — and it’s a great feeling, don’t get me wrong — but if we’re not making a profit…
Let’s just say that warm, fuzzy feelings don’t pay the bills.
The F&B industry is cut-throat — the average profit margin rate is between 3 and 5 per cent. Anything above that, and you’re golden. And, for a large enough operation, a 0.1% increase results in millions of euros per year.
And how do you get that percentage bump?
Well, research shows that businesses that use analytics can grow their margin by 8 to 10 per cent. At a time when major reshuffles are happening on the market, this boost in profitability can mean the difference between sinking or swimming. It can let you keep on employees that you’d need to fire otherwise. And it can provide both an incentive and a roadmap for growth.
And although it all ties back to profitability, there are several more major benefits that you can count on when using analytics:
- Analytics provides operation-wide insights — if you’re responsible for dozens of outlets, you know how much of a slog it can be to pull up and analyse many individual reports. Not only is this a time-suck, but it also opens the whole process up to human-made errors. With analytics, you have a single source of truth for every outlet and every connected data set. Switching between outlet reports and insights — and benchmarking them against each other — now takes seconds instead of hours.
- It also democratises your data — with analytics in place, every F&B and location manager can access the same insights. As a result, the conclusions they draw — and the decisions they make — don’t depend on their analytical skills. And when your managers are on the same page, it’s easier to get them on board when big decisions are made. For example, suppose you want to push for expansion in a particular area. In that case, the idea will be easier to sell to both your VP of Finance and location managers if you can show that the surrounding outlets are profitable but are struggling to increase staff productivity and meet the demand.
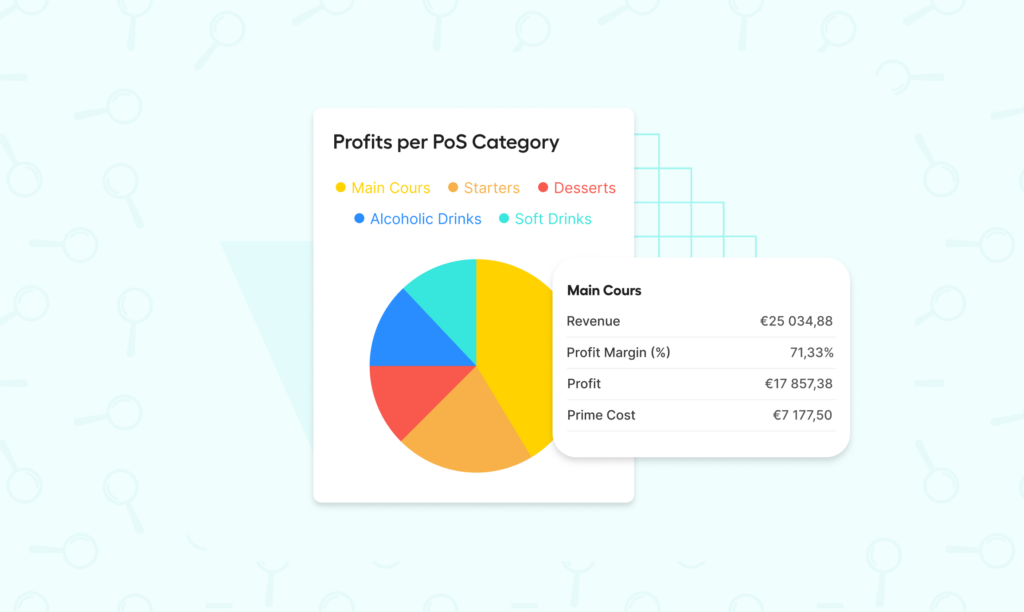
- And it uncovers emerging trends — Apicbase’s analytics hub will pick up on hidden patterns in sales and customer behaviour much faster than any human could. Things like shifts in eating habits, upticks in sales for specific categories, customers coming in earlier, and similar. These patterns could be statistically insignificant and therefore ignored on an outlet-to-outlet basis. But, once data is pooled and analysed, they’re flagged by the system, and you can consider them when planning menus and shifts.
It doesn’t take much to set up your restaurant analytics. If you’re using Apicbase, our analytics module [called the Insights Hub] is baked in and readily available.
Recommended Reading: Fire Up Apicbase for Location-Specific & Real-Time F&B Insights
That said, the insights you get are only as good as the data you feed into the system. So here’s a list of data sets you should consider if you want to get reliable, profit-boosting guidance.
What Data Sources Should You Feed to Your Analytics?
An average F&B operation can suffer from many things, but lack of data isn’t one of them.
Your POS system alone is responsible for collecting a metric ton of information, from sales numbers and other transactional data to data on payment methods and footfall. When you add your staffing, back-of-house, and other data to that pile, it’s a wonder your servers don’t buckle under the pressure, especially if you’re a multi-outlet business.
But the question is, should you analyse all that data? And if not, what do you prioritise?
The answer is no — you don’t need every last data set to run restaurant analytics. But, the more you include, the more accurate and detailed your insights will be. And as your business grows, some data sets [like review, delivery, and customer data] will become more valuable to you.
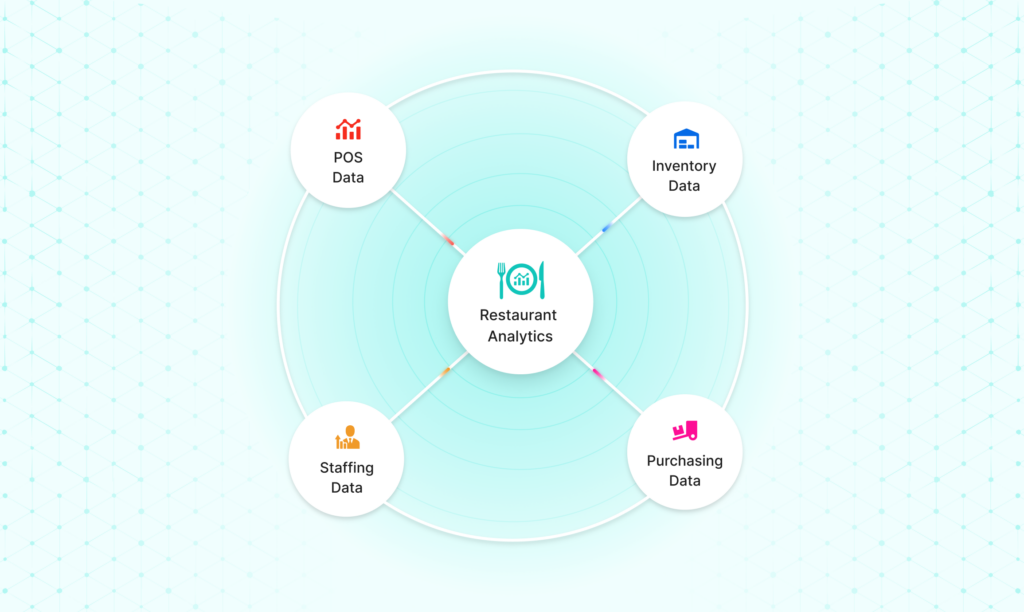
To get you started, here are a few core data sets that you should consider:
- POS data — your point-of-sale system is a treasure trove of information. Depending on how advanced it is, it can collect data on your sales, footfall, and customers, as well as data on gratuity, order types, and discounts. Some POS systems even track inventory data, although that information can be patchy and out-of-date.
This sales data can provide you with invaluable nuggets regarding your menus, and your analytics platform will heavily draw on it to give you insights into menu planning and menu engineering. - Inventory data — your inventory system keeps track of every ingredient used in your operation. It’s your first line of defence against erratic food costs — if you have a tight grip on your stock, avoiding waste due to overstocking, poor plating, or theft becomes much easier.
Most POS systems can be connected to the inventory system, which makes tracking your ingredients a breeze. However, Apicbase’s inventory module goes one step beyond, coupling inventory with procurement and tying it to automated costed recipes. This integration allows for real-time stock depletion of raw ingredients and keeps inventory variance under control.
Recommended Reading: The Ultimate Guide to Restaurant Inventory Management
- Staffing data — for some operations, labour costs can dwarf food costs. For this reason, most chains use a staff scheduling system to optimise rotas. If you use a version of this system, connecting it to your analytics can provide you with valuable information. For example, you can benchmark servers to see who has the highest productivity during peak times… and then see if you can get that person to pick up your busiest shifts. You can also find your best upseller this way and get them to mentor other servers and share their sales tips and tricks.
- Purchasing data — most operations don’t have a dedicated vendor management system. This is a big waste because the data you collect from vendors over time can lead to significant savings. Analytics software can take this data and tell you which vendor relationships to focus on — which vendors give you the best prices, deliver on time consistently, and don’t overcharge you through invoicing errors.
👉 Apicbase procurement module does all that and more. Because it’s connected to your inventory module, the system keeps track of stock levels and warns you when ingredients fall under par levels. You can even set it up to generate purchase orders automatically — all you need to do is double-check the quantities and push send to email your vendors. 👈
Recommended Reading: The Ultimate Guide to F&B Procurement for Restaurants & Central Kitchens
Your operation already captures a lot of these data sets.
But… a lot of them are ignored, too — especially on the back-of-house side.
So let’s take a quick look at what you get when you don’t make the mistake of ignoring your back-of-house data. When, in fact, you make it the centrepiece of your analytics strategy.
The Importance of Both FoH & BoH Data in Restaurant Analytics

With POS reports so accessible, many operators fall into the trap of tracking and analysing only sales and customer-centric data.
And I’m not saying there’s no value there, but… FoH-focused data = FoH-focused insights.
In an industry with such slim margins, can you afford not to know what’s happening with your back-of-house? After all, BoH labour + food costs eat up a solid chunk of your daily revenue.
Just imagine not knowing your food costs are increasing because you only check when the profit and loss statement rolls in. If the last P&L was a-okay, you have no reason to suspect your food costs are on the fritz until the extra cost shows up on the following statement.
Of course, by then, the damage is done.
The fact is, there are so many things that can go wrong in the kitchen. And you need a way to stay on top of them in real-time, not only find out about them six months after the fact.
This is where a restaurant data analytics solution that combines back-of-house and front-of-house data really shines. Using a platform like Apicbase — with integrated sales, purchasing, inventory, and menu planning modules, as well as powerful analytics capabilities — puts you in the driver’s seat of your operation.
Suddenly, when a menu item takes a profitability nose-dive, you’re not running around trying to figure out what’s happening. Your first instinct isn’t to correct the menu price. No — the first thing you do is look behind the curtain. Then you adjust portions, reduce waste, or change a supplier to mitigate the impact on your bottom line.
Reporting is Great… But It’s Analytics That Gives You Control
Accurate data is worth more than oil — or even gold — to your operation.
But not when it leaves you scratching your head, raising more questions than it answer. The key to side-stepping this problem — and finally understanding what makes your business tick — lies in giving data the appropriate context.
When you do that, you get a new measure of control, especially over your back-of-house and the associated costs. It becomes easier to dial in on things that work and correct operational hiccups in real time. And it becomes way easier to scale through expansion and franchising without making the same mistakes at every new location.
Does this sound like something that’s sorely missing from your current MO?
Let Apicbase Take It All Off Your Plate!
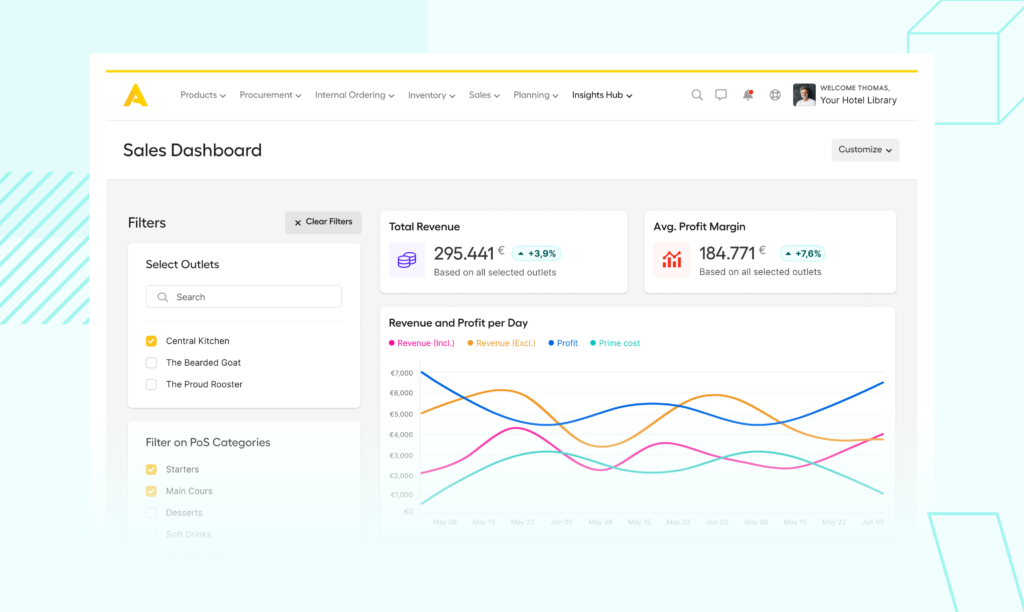
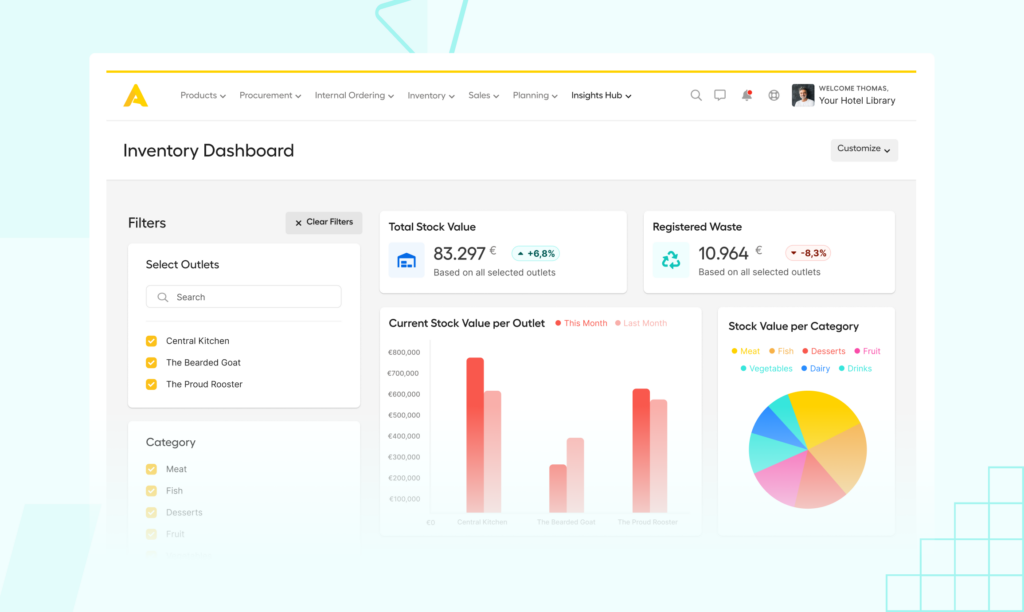
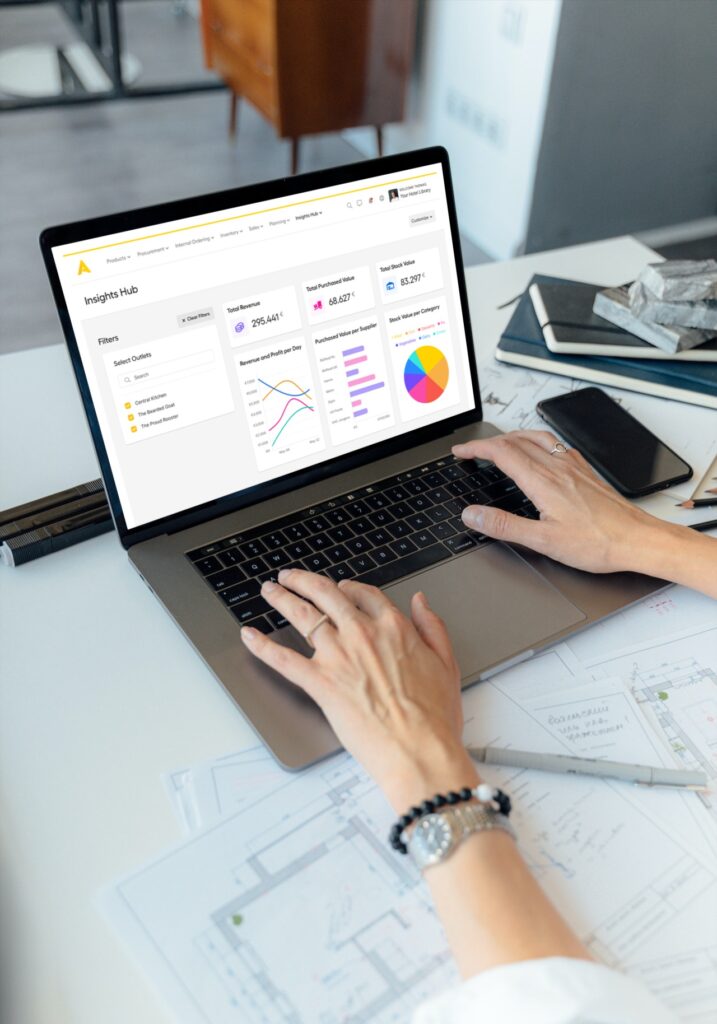
Our new restaurant analytics dashboard centre [dubbed the Insights Hub] provides actionable business-building information, with visualisations that make everything from historical and cross-location comparisons to inventory management a breeze.