Measuring performance is essential for running a successful business.
This is especially true for large-scale foodservice operations and scaling restaurant businesses.
In an industry where every detail matters, tracking metrics provides valuable insights into your restaurants’ performance and helps to identify improvement areas.
That’s the theory. In theory, it sounds easy.
In practice, however, successfully managing a group of busy restaurants is an awfully tough undertaking.
To help you out, we’ve put together this comprehensive guide on restaurant metrics.
The metrics and calculations in this list will help you bring order to the chaos and manage the performance of each unit in the chain.
From customer satisfaction to profitability, there are countless metrics that restaurant owners and managers should track to gain a better understanding of their operations. And with the rise of modern business intelligence tools, staying on top of these key metrics is easier than ever.
Why Are Metrics Important?
The principle ‘what gets measured, gets managed‘ is at the heart of effective restaurant management. For successful operation, it’s crucial to have a clear understanding of the business performance across various areas.
Monitoring key metrics reveals both the strengths and the areas needing improvement. With this insight, managers can make data-driven decisions, optimally allocate resources, and strategically adjust operations, thereby driving efficiency and profitability.
Rather than relying on intuition or guesswork, metrics will help you understand how different aspects of your restaurant are doing, so you can adjust your strategies accordingly.
Additionally, tracking metrics will help identify trends and patterns over time, allowing restaurants to make proactive changes and stay ahead of the competition.
Example
Take Fabio Haebel, founder of the popular dark kitchen network Circus in Hamburg. By regularly tracking his inventory and procurement metrics, Fabio was able to reduce his kitchens’ food costs by 18%. It’s money that went straight to his bottom line.
This blog provides an organised overview of the key metrics multi-site restaurant brands should track.
Whether you’re looking to improve customer satisfaction, increase sales, or reduce costs, tracking these metrics will bring clarity to your restaurants’ performance and help you achieve your goals.
So grab a coffee, sit back, and let’s dive in and explore the world of restaurant metrics.
Metrics vs. Restaurant KPIs: What is the Difference?
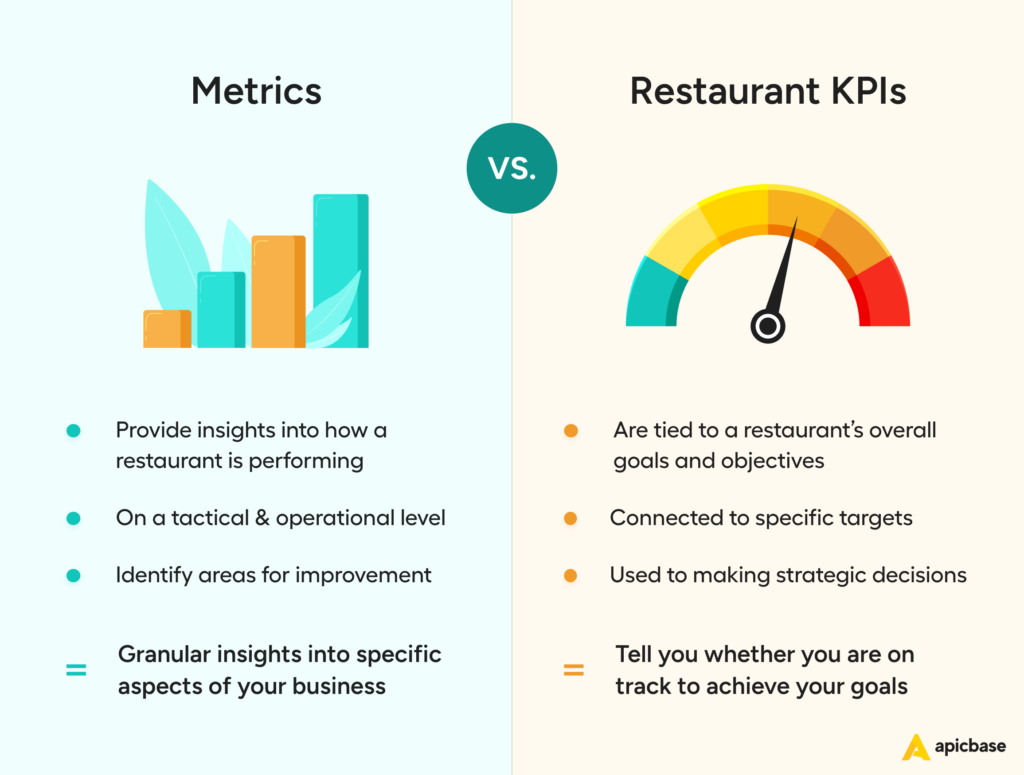
Understanding metrics and KPIs (Key Performance Indicators) is essential when managing a restaurant. While the two terms are often used interchangeably, they have distinct differences that are important to understand.
To illustrate, think of driving to a dinner date by car. The speedometer measures how fast you’re driving – this is a metric. It gives you valuable information but doesn’t tell you if you’re getting closer to your goal, which is arriving at the restaurant at 8 pm sharp.
On the other hand, your GPS provides an estimated time of arrival (ETA) – this is a key performance indicator (KPI). The ETA measures progress towards your ultimate goal – reaching your destination on time. While the speedometer (metric) provides useful data, the ETA (KPI) directly ties to achieving your goal.
- Metrics are measurements that provide data on various aspects of a restaurant’s performance. They are operational or tactical and have a lower-level perspective than KPIs. Metrics provide insights into how a restaurant is performing and identify areas for improvement.
Going back to the dinner date, if you’re stuck in slow traffic, and your speed is going down (metric), you can improve your chances of arriving at the restaurant on time by choosing a different route. That choice will have a direct effect on your ETA (KPI).
- KPIs are specific metrics tied to a restaurant’s overall goals and objectives. Restaurant KPIs measure progress toward these goals and are typically connected to specific targets or benchmarks. They are used to making strategic decisions and have a higher-level perspective than metrics.
Although different, KPIs and metrics are essential to the health of your restaurant.
KPIs tell you whether you are on track to achieve your goals, while metrics provide more granular insights into specific aspects of your business. Metrics help you identify the parts of your operation that need extra attention to achieve your business goals.
How to Process Restaurant Metrics
To process restaurant metrics, you must gather data on various aspects of your restaurant’s operations, such as sales, expenses, customer satisfaction, and employee performance.
You can collect this data through various channels, including point-of-sale (POS) systems, accounting software, customer feedback surveys, and social media reviews.
Remember, data is only as good as what you do with it. Once you have collected the information, you can analyse the data to gain insights into your restaurant’s performance and identify areas for improvement.
For example, you can use sales data to track trends in customer spending and identify your most profitable menu items.
You can use labour cost data to optimize staffing levels and schedule shifts more efficiently. You can use customer feedback to identify areas of the restaurant that need improvement and address any concerns or complaints.
Different metrics can provide different insights into your restaurant’s performance. There are three levels to processing metrics.
Level 1: Metrics Calculation as a Pulse Check
At its most superficial level, metrics calculation provides a snapshot of a specific time and context, like a pulse check for a restaurant. Regularly checking metrics allows patterns to emerge, which can help identify hidden costs, opportunities for process optimization, and ways to increase profitability.
Think of it as your restaurant’s regular health check-up.
Level 2: Daily Metrics Calculation with Technology
Technology can automatically make calculations daily, per day part, per channel, and more. This provides even greater depth to the emerging patterns and allows for more minor mistakes to be identified and addressed before they can significantly impact the business. By using technology to calculate metrics, you can optimize restaurant operations and ensure you’re running at maximum efficiency.
In the fast-paced world of the food service industry, having this kind of quick, daily check can be a game-changer.
Level 3: Data Analytics Software for Broader Insights
With the abundance of data technology generates, data analytics software can connect data points and provide clear dashboards that paint a broader picture. This gives even more depth to the emerging patterns and allows for a more comprehensive analysis of the restaurant’s operations.
By using business intelligence (BI) software, you gain a deeper understanding of your restaurant analytics and make data-driven decisions to improve operations, increase profitability, and enhance the customer experience.
Imagine being able to predict your busiest days, most popular dishes, and even the most efficient staff schedules – it’s all possible with the right metrics and software.
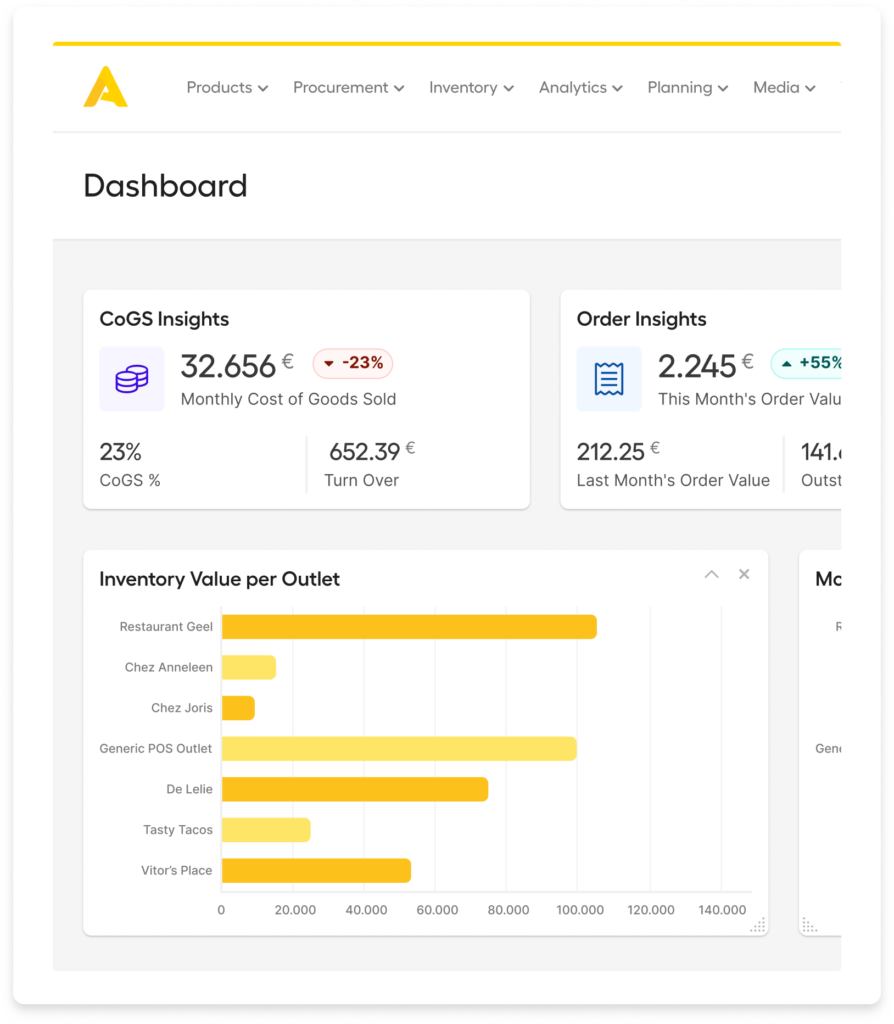
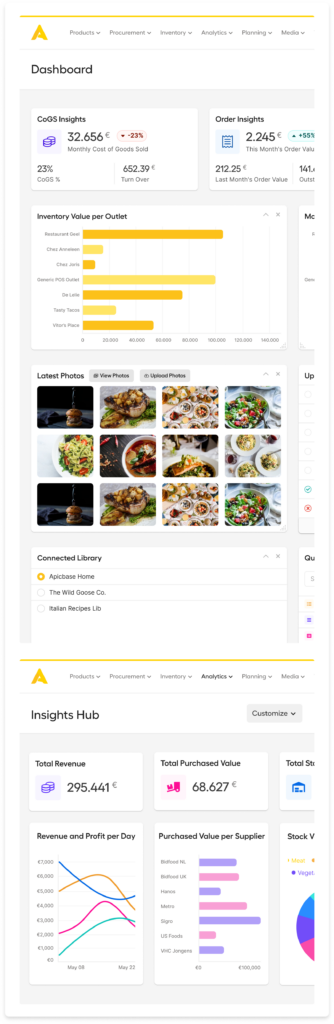
Get a 360-view of your sales & inventory data
Adopt restaurant analytics software. It turns raw data into powerful performance dashboards packed with insightful graphs and charts, so you can track growth, spot discrepancies, and help your teams make the right call at every turn.
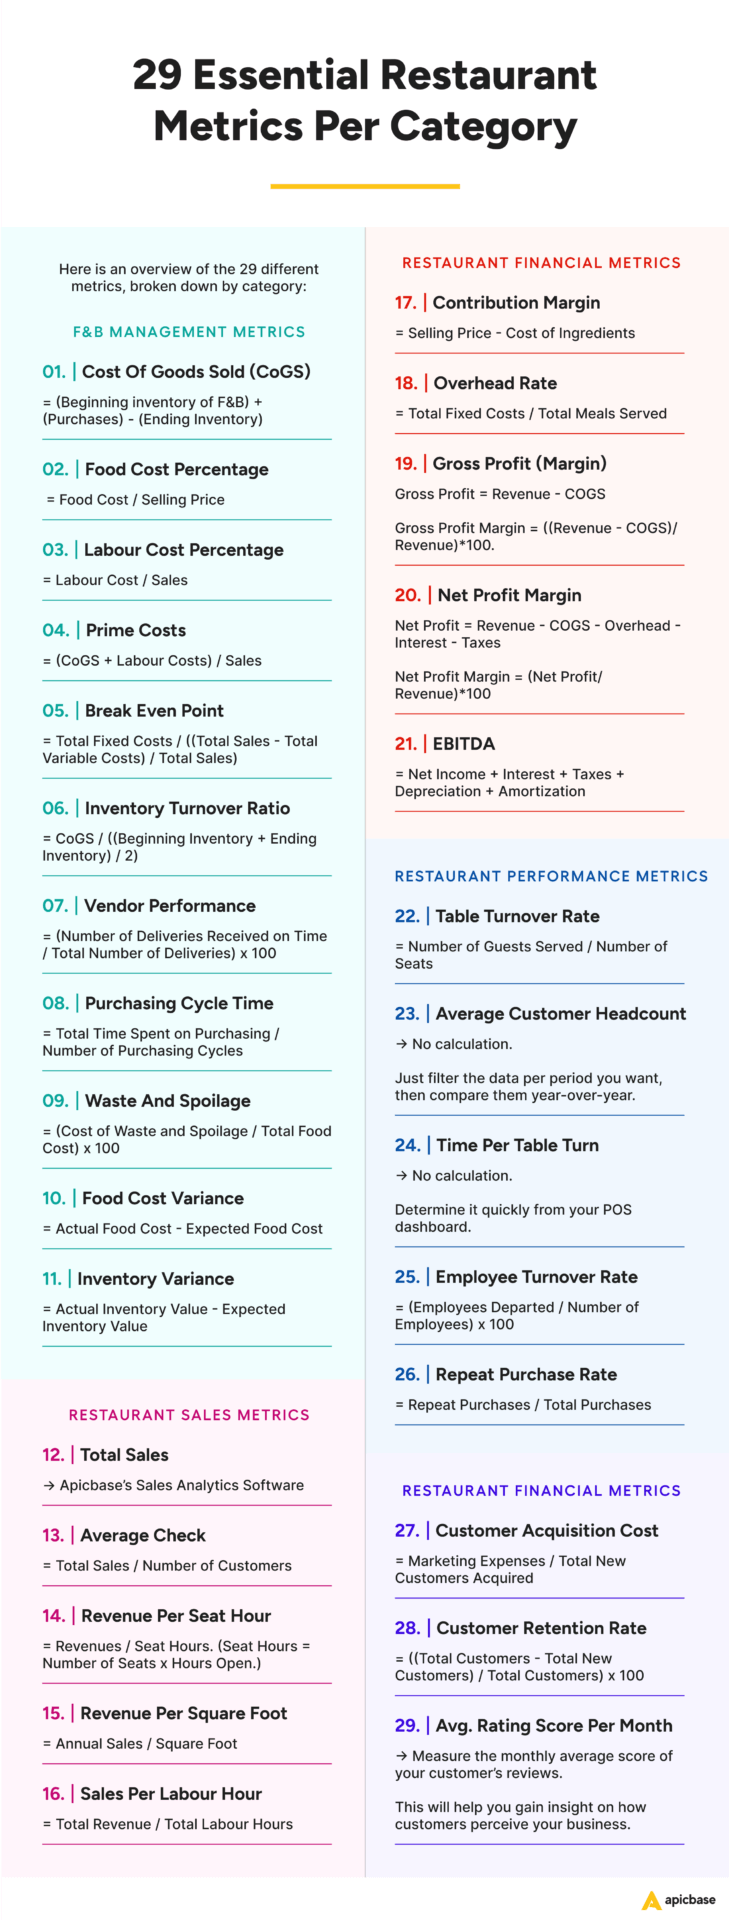
Essential Restaurant Metrics Per Category
Before we continue, it’s important to note that specifying a timeframe is crucial when measuring performance.
The timeframe for measurement, daily, weekly, monthly, yearly, depends on the metric and your restaurant’s specific needs. Daily sales or foot traffic, for example, are obviously best measured daily.
On the other hand, if your restaurant operates with a seasonal menu, quarterly metrics could be more revealing. Industry standards also play a role, as they often dictate accepted timeframes for specific metrics. Prime costs, to name one, are usually calculated weekly.
That said, let’s dig in.
- F&B Management Metrics
- Restaurant Sales Metrics
- Restaurant Financial Metrics
- Restaurant Performance Metrics
- Restaurant Marketing Metrics
F&B Management Metrics
1. Cost of Goods Sold (CoGS)
What does CoGS mean? Actual food cost, otherwise known as Cost of Goods Sold (CoGS) measures the total cost required to produce every dish on your menu. It includes the cost of ingredients, packaging, and other costs associated with producing the food and beverages.
COGS help you determine if you’re pricing your menu items correctly based on the purchase price of the ingredients. It will also tell you if your food cost is high and if you meet the industry standards of 20 – 40% CoGS.
To calculate CoGs: CoGS = (Beginning Inventory of F&B) + (Purchases) – (Ending Inventory)
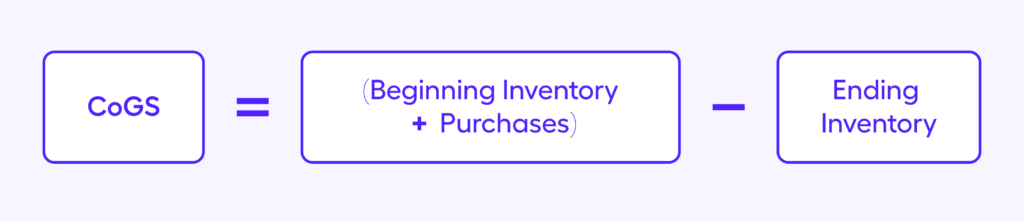
Knowing your weekly CoGs allows you to control your inventory more accurately and prevent it from affecting your profits.
Manually crafting a profitable menu for large-scale foodservice enterprises can be like solving a complex puzzle, consuming time and resources.
Consider menu engineering software as your strategic ally. It automates the analysis, uncovers optimal dish profitability and popularity, and transforms your menu into a masterpiece of profit generation.
2. Food Cost Percentage
This metric measures that proportion of your food cost with your overall sales. It tells you if you’re pricing an item correctly and whether it will be profitable or not.
To calculate food cost percentage for a single product: Food Cost Percentage Per Menu Item = Food Cost / Selling Price
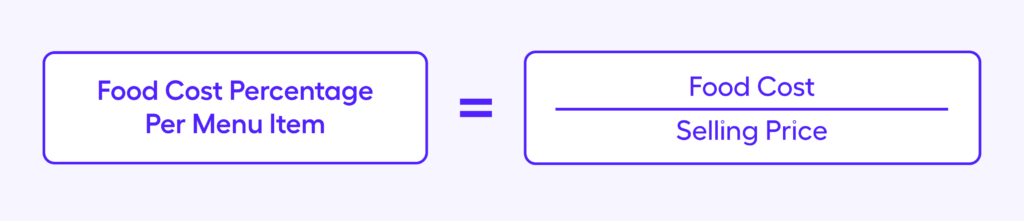
You should also get the overall food cost percentage by dividing the total food cost (see COGS calculation) by your total sales for a specific period.
Check our in-depth on how to calculate food cost for a better understanding of this critical measure for restaurant business success.
By keeping an eye on food cost percentages, you can identify problems such as rising supplier costs, spoilage, portioning issues and problematic shrinkage before they affect your profits. Most restaurants aim for 30% food costs, but dark kitchens can go as low as 20%. Obviously, the lower the percentage, the higher your profitability will be, unless you start compromising on quality, which will affect sales.
3. Labour Cost Percentage
This metric is the proportion of your restaurant’s revenue spent on paying employee wages, salaries, and benefits. This includes all front-of-house and back-of-house staff, such as servers, bartenders, chefs, and dishwashers.
Labour costs are one of the primary expenses of any restaurant, and knowing this percentage will help you ensure your business yields a healthy bottom line. Industry standards for labour cost percentage are 20- 30% of sales and, together with CoGS, should be no higher than 60% of a restaurant’s total expenses.
To calculate labour cost percentage: Labour Cost Percentage = Labour Cost / Sales
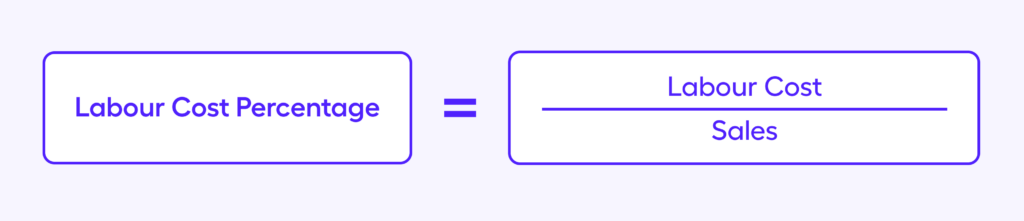
Pro Tip: To identify what’s affecting your labour costs, divide the staff by FOH (front of house) and BOH (back of house).
4. Prime Costs
Prime cost is the sum of a restaurant’s COGS and labour costs. As mentioned, it should be around 60% of your overall sales. You can be in financial trouble if it’s higher than 70%, and you might be sacrificing quality and overworking your staff if it’s below 55%.
To calculate prime costs percentage: Prime Costs Percentage = (CoGS + Labour Costs) / Sales
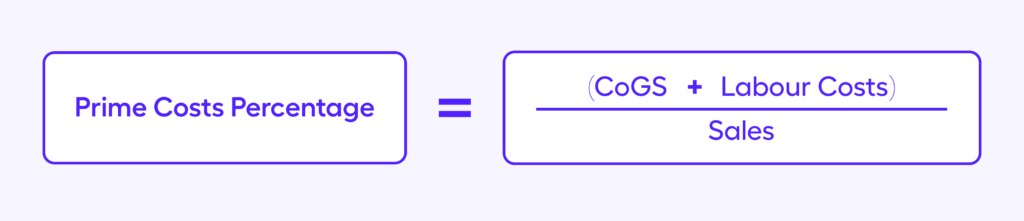
By monitoring prime costs regularly, you can adjust your operations to ensure that it is running efficiently and cost-effectively.
5. Break Even Point
When your restaurant hits the breaking even point, its total revenue equals its total costs. This means you’re not making a profit, but also not losing money. Your restaurant has covered all its fixed and variable costs, including rent, labour, and COGS.
To calculate the break-even point: Break-Even Point = Total Fixed Costs / ((Total Sales – Total Variable Costs) / Total Sales)
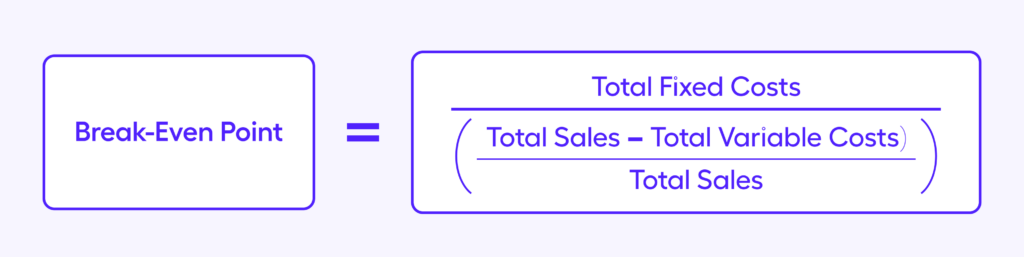
Knowing your break-even point will help you determine if you’re spending more than you’re earning, which, when left ignored, can burn your restaurant to the ground. This metric is also used to determine how long it will take before you can recover the investments you made into the business.
6. Inventory Turnover Ratio
This restaurant inventory metric measures how often your business depletes its total inventory. Monitoring this number prevents your teams from overstocking or understocking, which can lead to food waste and higher food costs.
To calculate the inventory turnover ratio: Inventory Turnover Ratio = CoGS / ((Beginning Inventory + Ending Inventory) / 2)
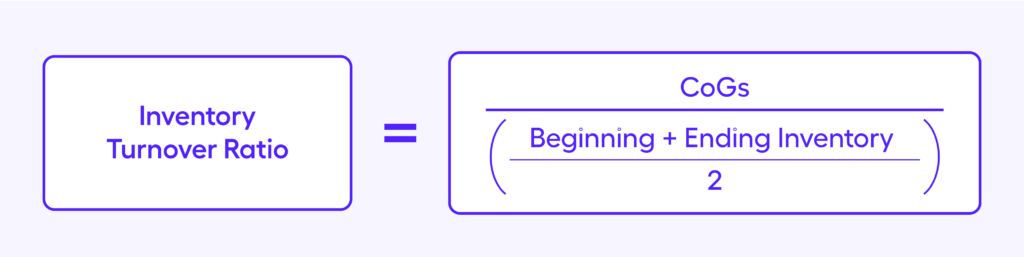
A low inventory turnover ratio is a sign of overstocking or a slowdown in sales, while a high number means sales are picking up and you’re in danger of running out of stocks.
7. Vendor Performance
Running a restaurant involves dealing with multiple vendors or suppliers and managing an often complex supply chain. By measuring vendor performance, you have an accurate metric to gauge whether a supplier is up to speed on their commitments.
There are several vendor management metrics, but an important one is related to timely deliveries. To calculate vendor performance in terms of deliveries, you can use this formula: Vendor Performance = (Number of Deliveries Received on Time / Total Number of Deliveries) x 100
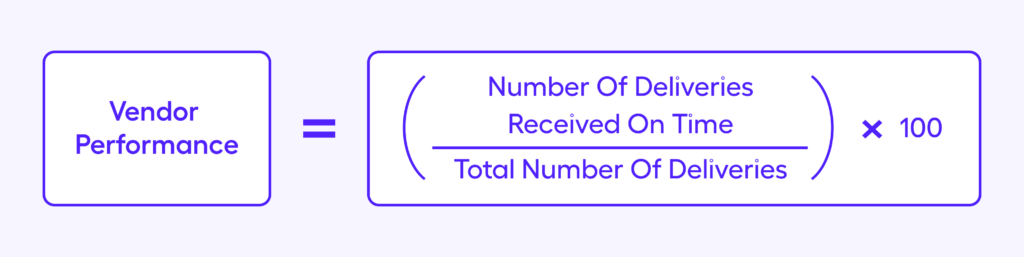
This formula tells you how many vendor deliveries were received on time, so you can track which vendors regularly fall behind schedule.
These are the suppliers you need to talk to. Late deliveries mean your unit-managers need to come up with ad hoc, and often costly, solutions, that bite into your profit margins. However, before jumping on an angry call, make sure your teams are following standard ordering procedures, and if so, if the protocols are still up to par.
This will allow you to devise ways to improve timeliness and ensure the rest of your supply chain doesn’t suffer.
8. Purchasing Cycle Time
This formula measures the average time it takes to complete a purchasing cycle, from placing an order to receiving the products. It requires recording the start and end times of each purchasing cycle and calculating the average time taken to complete them.
To calculate this metric: Purchasing Cycle Time = Total Time Spent on Purchasing / Number of Purchasing Cycles

Knowing your purchasing cycle time will help you make better procurement decisions, such as adjusting the ordering schedule, working with suppliers who have faster delivery times, or ordering in larger quantities to ensure you have enough inventory on hand.
This will also improve supply chain efficiency, reducing waste and improving stock management.
Fluctuating demand, perishable inventory, supplier inconsistency, and cost fluctuations – restaurant purchasing is tricky and complex. Every misstep can lead to waste, financial losses, and a tarnished reputation.
Dedicated restaurant purchasing software offers a solution, utilizing predictive analytics to manage inventory, evaluate suppliers, and control costs. The software takes the guesswork out of the ordering process and streamlines operations, which increases efficiency, and boosts your bottom line.
9. Waste and Spoilage
Waste and spoilage refer to the loss of food, ingredients, and other materials due to spoilage, overproduction, or other reasons.
Food waste is a pressing issue in the restaurant sector. It presents a significant environmental problem, and it also erodes profit margins, increasing financial strain for businesses. The first step to addressing this issue is measuring the percentage of food waste. Understanding what and how much is being wasted creates an urgency to improve. This awareness encourages staff to be more vigilant and compels managers to enhance processes and execution, driving overall efficiency.
To calculate this metric: Waste and Spoilage = (Cost of Waste and Spoilage / Total Food Cost) x 100

This formula measures the percentage of wasted or spoiled food compared to the total cost of food purchased. Knowing this percentage will help you identify areas where you’re losing money, so you can take steps to reduce those losses and increase profitability.
Reducing food waste will help improve your sustainability practices and reduce environmental impact.
10. Food Cost Variance
Food Cost Variance is a metric that measures the difference between the actual cost of the food used in your restaurant and the expected or budgeted (theoretical) cost. This metric is used to monitor the efficiency of your restaurant’s food cost management practices and identify areas where cost savings can be made.
The formula to calculate food cost variance is: Food Cost Variance = Actual Food Cost – Expected Food Cost
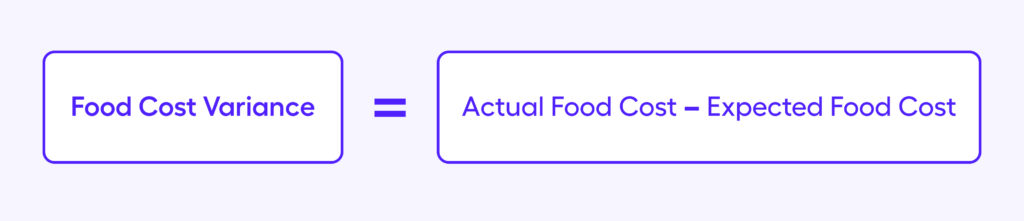
“Actual Food Cost” represents the actual cost of the food used in a restaurant during a specific period of time (e.g., a week, a month, or a quarter), while the theoretical food cost or “Expected Food Cost” represents the budgeted or target cost of the food used during the same period of time.
Actual food cost is determined by the monetary value of inventory depletion within a certain time frame (a week or month) expressed in monetary terms. Expected food cost is a multiplication of the portion price of each menu item and the number of times a menu item was sold during that period.
Ideally, variance should be zero. If the number isn’t zero, then somewhere between raw material intake and finished products, you’re losing money due to waste, theft, inaccurate portioning or price fluctuations. However, zero variance isn’t realistic. It’s often recommended to aim for a variance of 2-3%. If the variance consistently exceeds this range, it may indicate issues that need to be addressed, such as inefficiencies in food preparation, changing market prices, or problems with suppliers.
Monitoring Food Cost Variance helps restaurants to control their costs by identifying areas where they are overspending or where there are opportunities to reduce costs. By identifying these areas, restaurants can adjust their procurement, inventory and production practices to reduce avoidable costs and improve profitability.
This metric also helps you manage inventory more effectively and ensure you’re pricing menu items correctly.
You can monitor variance manually in spreadsheets. However, when you are working on a bigger scale, running multiple sites, you might not get the results you need. Data consolidation takes up a lot of time and involves many people, making it prone to errors.
When operating at a large scale, using food costing software may be more convenient for you. It automates food cost calculations and gives you direct access to real-time variance reports, both group-wide and per outlet.
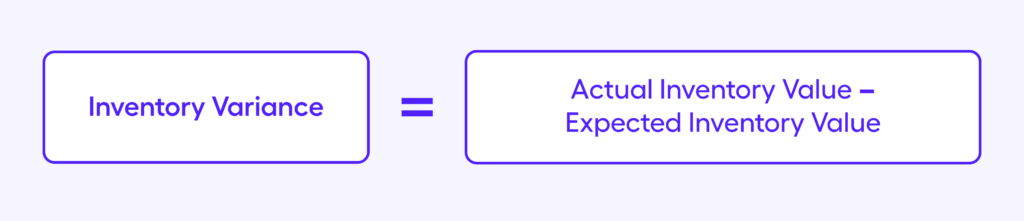
11. Inventory Variance
Inventory Variance (also called shrinkage) measures the difference between the actual inventory levels of your restaurant versus the expected or target inventory levels. This metric monitors the efficiency of a restaurant’s inventory management practices.
Ideally, you want zero variance, but shrinkage is unavoidable in the hospitality business. Instead, you can aim for the lowest number possible.
By tracking this metric, you’ll identify areas where there may be spoilage, overuse, or other issues, so you can arrest them early on before they become a bigger headache.
The formula for inventory variance is: Inventory Variance = Actual Inventory Value – Expected Inventory Value
Knowing your inventory variance requires doing a physical count of your stocks to know the actual inventory and generating data from your POS system for the expected inventory. It’s important to note that Inventory Variance should be calculated regularly. A weekly or monthly count is the rule.
You can do all this manually or use restaurant inventory management software. If you operate on a large scale, the latter might be the best option for you, as it avoids the need for kitchen staff to count stock on a daily basis. The system uses sales figures to calculate stock levels and automates the analysis for head office. It offers huge time savings.
Restaurant Sales Metrics
12. Total Sales
Sales is the most important metric any restaurant owner needs to know on a daily basis. It’s the foundation of all the metrics you’d track and will help you understand your business’ performance and profitability.
To determine sales for your restaurant, you need to track the total revenue generated from all sources, including food and beverage sales, catering services, merchandise sales, and any other revenue-generating activities. You can use your point of sale (POS) system to track sales data automatically.
Tracking sales data over time can help you identify trends and patterns in customer behaviour, such as changes in demand for certain menu items or fluctuations in customer traffic. If you have multiple locations, you can use sales to compare performance across these branches and determine the top and least performing ones.
You can also compare your performance to industry benchmarks and identify areas where you may be underperforming or exceeding expectations. This information can help you make strategic adjustments to your business operations and improve your competitive position in the market.
Are you struggling with poorly performing menu items? Restaurant sales analytics software provides you with real-time data on sales and food costs. You get a holistic understanding of menu performance so you can make informed decisions about which items to kill, push or fix.
13. Average Revenue Per Customer / Average Check
Average check measures how much you expect every guest to spend on their meal. This is an important metric to measure because it can help businesses make informed decisions about pricing and menu offerings. It’s a common KPI used to gauge restaurant performance.
To calculate this metric: Average Check = Total Sales / Number of Customers

By tracking the average check, you can identify which menu items are most popular and profitable and adjust pricing and promotions accordingly. You can use this metric with Average Customer Headcount to optimise staff scheduling.
14. Revenue Per Seat Hour (RevPASH)
This metric measures how much revenue a restaurant generates during each hour that a table is occupied.
To calculate RevPASH: RevPASH = Revenues / Seat Hours. (Seat Hours = Number of Seats x Hours Open.)
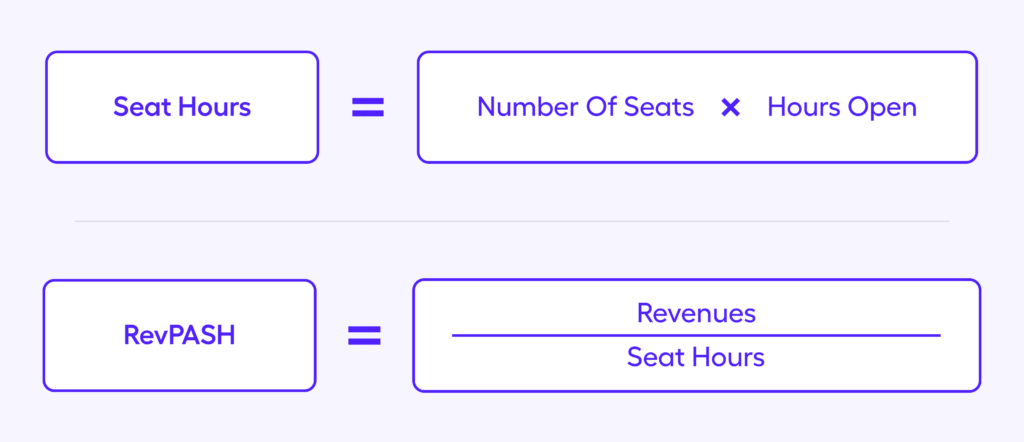
Knowing this metric will help you identify which days and day parts are performing lower than others so you can determine strategies to improve them.
15. Revenue per Square Foot
This metric measures how much revenue a business generates per unit of space. This is important to measure because it helps you optimise the use of your space and make informed decisions about location and expansion.
To calculate revenue per square foot: Sales Per Square Foot = Annual Sales / Square Foot

By tracking revenue per square foot, you can identify which locations generate the most revenue and which spaces are underutilised. This can inform decisions about rent negotiation, lease renewals, and expansion opportunities.
16. Sales per Labour Hour
This metric provides insights into your workforce’s productivity by measuring how much revenue each employee brings for every hour worked.
To calculate sales per labour hour: Sales Per labour Hour = Total Revenue / Total Labour Hours

By tracking sales per labour hour, you can identify areas where you can improve productivity, such as by optimising staffing levels, improving training and development programs, or streamlining processes.
Restaurant Financial Metrics
17. Contribution Margin
This metric measures the profitability of a specific item in your menu. It indicates the amount of revenue that is left over after deducting the ingredient costs associated with producing the item.
To calculate the contribution margin: Contribution Margin = Selling Price – Cost of Ingredients

The contribution margin helps you determine which menu items are the most profitable and which may need to be adjusted or removed from the menu. This also lets you know how much profits your top-selling items contribute and helps you make marketing promotions such as upsells and upgrades.
Also read: Menu Engineering: How Large Restaurant Operators Add 10-15% to Their Bottom Line
18. Overhead Rate
Overhead expenses are the indirect costs a restaurant incurs, such as operational expenses like rent, utilities, taxes, administrative staff salaries, insurance, licences, and permits. It’s the opposite of prime costs. These are fixed costs that your restaurant pays regardless of the influx of customers.
To calculate the overhead cost rate for a restaurant, you need to choose a cost driver first. A cost driver is a unit that you’ll use to measure your overhead costs. Depending on your restaurant’s business model, you can choose different cost drivers like the number of meals served, hours of operation, or the square footage of the restaurant space.
For example, if you’re a fast-food restaurant serving hundreds of meals a day, you might choose meals served as your cost driver. If you’re a high-end restaurant that only serves a few dozen meals a day, you might choose hours of operation or square feet of restaurant space.
The formula to calculate the overhead rate based on meals served is: Overhead Rate = Total Fixed Costs / Total Meals Served

If your total overhead costs are €10,000 per month and you serve 2,000 meals in a month, your overhead rate per meal would be €5.This metric helps you understand the true cost of operating the business. By measuring the overhead rate, you can ensure that you’re pricing menu items appropriately to cover all the expenses and make a profit.
19. Gross Profit & Gross Profit Margin
This financial metric measures a restaurant’s profitability after deducting the cost of goods sold (COGS).
To calculate the gross profit: Gross Profit = Revenue – COGS. Gross Profit Margin = ((Revenue – COGS)/Revenue)*100.
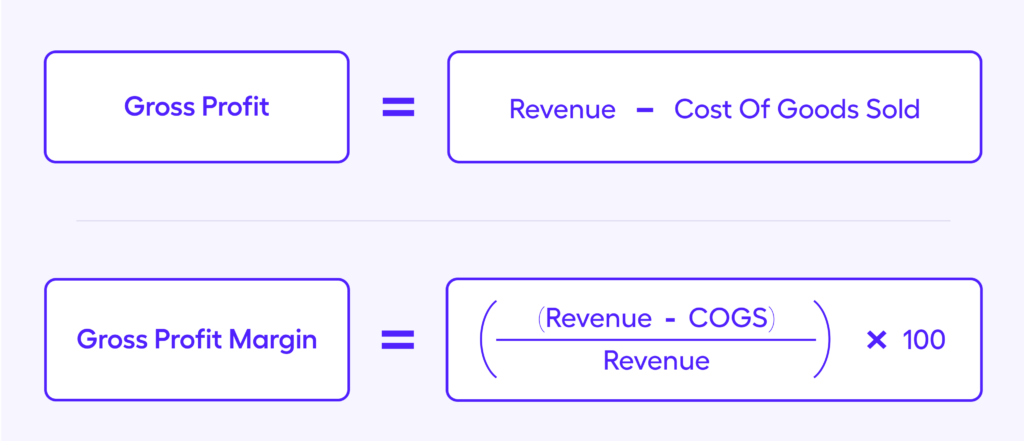
Gross profit is an important metric for restaurants, as it shows how much money you make after accounting for the direct costs of producing your products. Ideally, you should have a 70% gross margin so that you’ll have enough to pay for your overhead expenses, such as rent and labour.
Most restaurants also use this metric as a Key Performance Indicator.
20. Net Profit Margin
This is a financial metric used to measure a restaurant’s profitability after accounting for all expenses.
To calculate the net profit: Net Profit Margin = (Gross Profits / Total Revenue) x 100 or Net Profit Margin = Net Income / Gross Sales
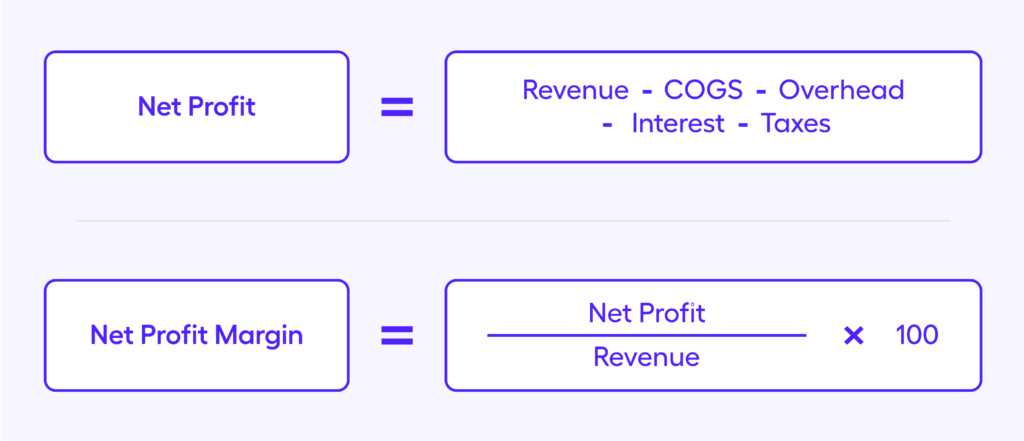
Net profit margin gives you a sense of your overall profitability. It considers all expenses, including fixed and variable costs, and provides a percentage that can be used to compare profitability to other restaurants or industries.
When your business is profitable, you can entertain opportunities for growth and expansion. Together with gross profit, net profit margin is also an important franchise restaurant performance metric.
21. EBITDA
EBITDA (Earnings Before Interest, Taxes, Depreciation, and Amortization) is a financial metric used to measure a restaurant’s operational efficiency. EBITDA focuses on earnings from core business operations, removing the impact of financing decisions, accounting conventions, and tax environments by adding back interest, taxes, depreciation, and amortization to net income. It provides a simplified view of the profitability from the company’s operations, regardless of these factors.
To calculate EBITDA: EBITDA = Net Income + Interest + Taxes + Depreciation + Amortization
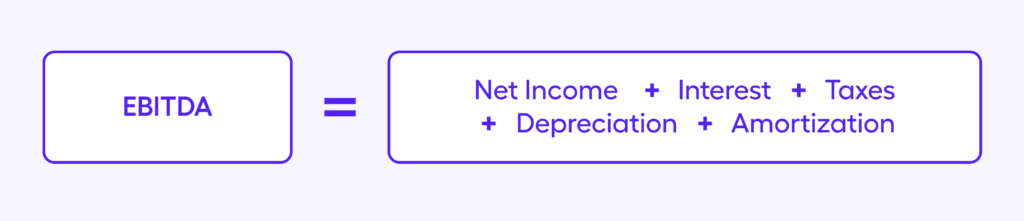
EBITDA is an important metric for investors and lenders as it provides insight into a restaurant’s ability to generate cash flow. By excluding non-operational expenses, EBITDA can provide a clearer picture of a restaurant’s profitability. This metric is used to compare restaurant concepts and help investors determine the most profitable venture.
Restaurant Performance Metrics
22. Table Turnover Rate
This metric refers to the number of times a table is used during a specific period.
To calculate table turnover: Table Turn Time = Number of Guests Served / Number of Seats

A high table turnover rate means that a restaurant is maximizing the number of guests it can serve, which translates to more revenue. However, it’s important to balance this with providing a good dining experience for guests and not rushing them through their meals.
23. Average Customer Headcount
The average customer headcount is a metric that lets you know how many customers were served in a given period. This metric helps you determine your restaurant’s busiest and slowest days of the week.
You don’t need to calculate this metric because it’s reflected in every mobile POS analytics dashboard. Just filter the data per period you want, then compare them year-over-year.
Knowing this metric will help you optimize staff scheduling, inventory forecasting, and marketing promotions.
24. Time per Table Turn
This metric measures the average length of time that a table is occupied before it is turned over for the next set of guests.
You don’t need to calculate this metric because you can determine it quickly from your POS dashboard.
Time per table turn provides insights into your operations’ efficiency and the dining experience’s quality. By tracking time per table turn, you can identify areas where you can improve service quality, such as by reducing wait times, streamlining ordering and payment processes, and improving staff training. This can lead to higher customer satisfaction, increased revenue, and improved overall operations.
25. Employee Turnover Rate
This refers to the rate at which employees leave a company and are replaced by new hires. Employee turnover is a significant expense for a business regarding recruitment, training, and lost productivity.
High employee turnover can also negatively impact company culture and morale. By tracking employee turnover, businesses can identify problem areas and take steps to improve employee retention, such as offering better compensation, benefits, or training opportunities.
The formula for employee turnover rate is: Employee Turnover Rate = (Employees Departed / Number of Employees) x 100
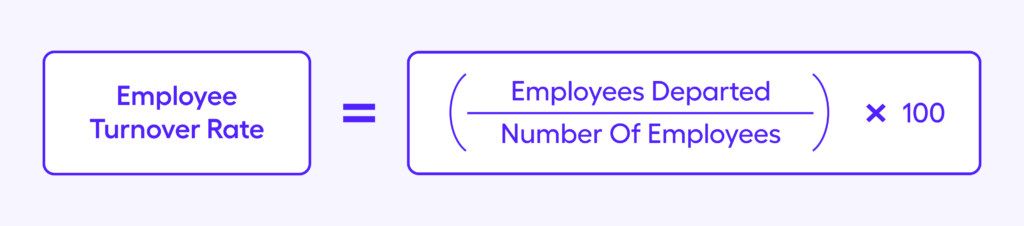
In analysing employee turnover rates, consider the seasonality that normally causes high turnovers. This metric is also used as a primary restaurant KPI to help business owners meet people-related strategic goals.
26. Repeat Purchase Rate
For concepts with thriving food delivery operations, measuring repeat purchases is an excellent indicator of the popularity of a certain menu item. The repeat purchase rate (RPR) is a common KPI used by eCommerce stores to gauge a customer’s loyalty, and can be used by restaurants to gauge the popularity of menu items.
The formula for repeat purchase rate of a menu item is: Repeat Purchase Rate = Repeat Purchases / Total Purchases

You can use this metric to know the market value of your new offers. For example, you launched a new dish, and it sold really well within the first month. Knowing how many customers went back to repurchase during the following months will tell you if the product is worth keeping for the long run.
Listen to: The Future of Food Delivery In Europe: Key Drivers For Success
Restaurant Marketing Metrics
27. Customer Acquisition Cost (CAC)
This is the money you spend on marketing and advertising to acquire each new customer. It is crucial to measure CAC because it provides insights into the effectiveness of your marketing campaigns and helps ensure they are making a positive return on investment (ROI).
To calculate CAC: CAC = Marketing Expenses / Total New Customers Acquired
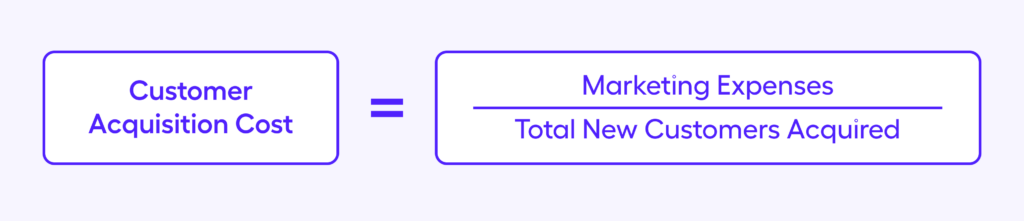
By tracking CAC, you can determine areas where you can reduce marketing expenses and optimize customer acquisition strategies to attract new customers more efficiently. For example, you can compare several campaigns and determine to cut the ones with high CAC.
28. Customer Retention Rate
Attracting new customers is great, but retaining them is equally important. Customer retention rate refers to the percentage of customers who continue to use a business’s services over a specified period.
To calculate customer retention rate: Customer Retention Rate = ((Total Customers – Total New Customers) / Total Customers) x 100
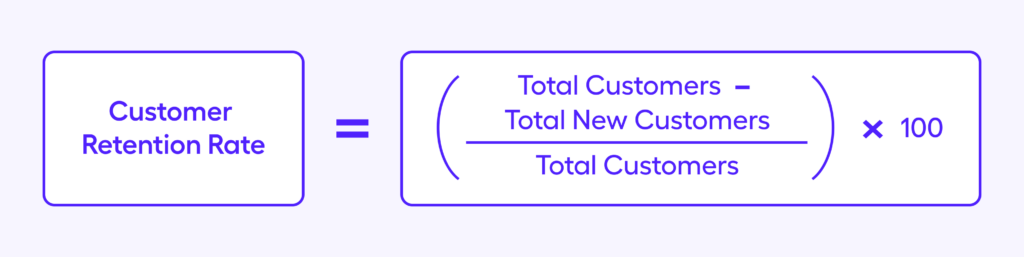
Acquiring new customers is more expensive than retaining existing ones. Knowing your customer retention rate will help you identify strategies to improve customer experience and get loyal customers. The average CRR for the hospitality/travel/restaurants industries is just 55%
Additionally, a high customer retention rate can reduce customer acquisition costs, as loyal customers are more likely to refer friends and family and provide positive online reviews, which can help to attract new customers.
29. Average Rating Score per Month
Customer feedback is crucial in a highly competitive industry like the food industry. With Average Rating Score per Month, you measure the monthly average score of your customer’s reviews. This will help you gain insight on how customers perceive your business.
To know your average rating score per month, you can look at your review scores across popular review sites like Yelp, Google Business, and others. You can also run your own review system that generates the average rating automatically.
Key Restaurant Metrics To Follow
It can get overwhelming trying to keep up with all of these metrics. While they each give valuable insights into your business, you don’t want to be bogged down with numbers and lose sight of your main goal, which is delivering a great customer experience.
By focusing on the five key restaurant metrics below, you can stay on top of your business performance while also making sure your guests are happy.
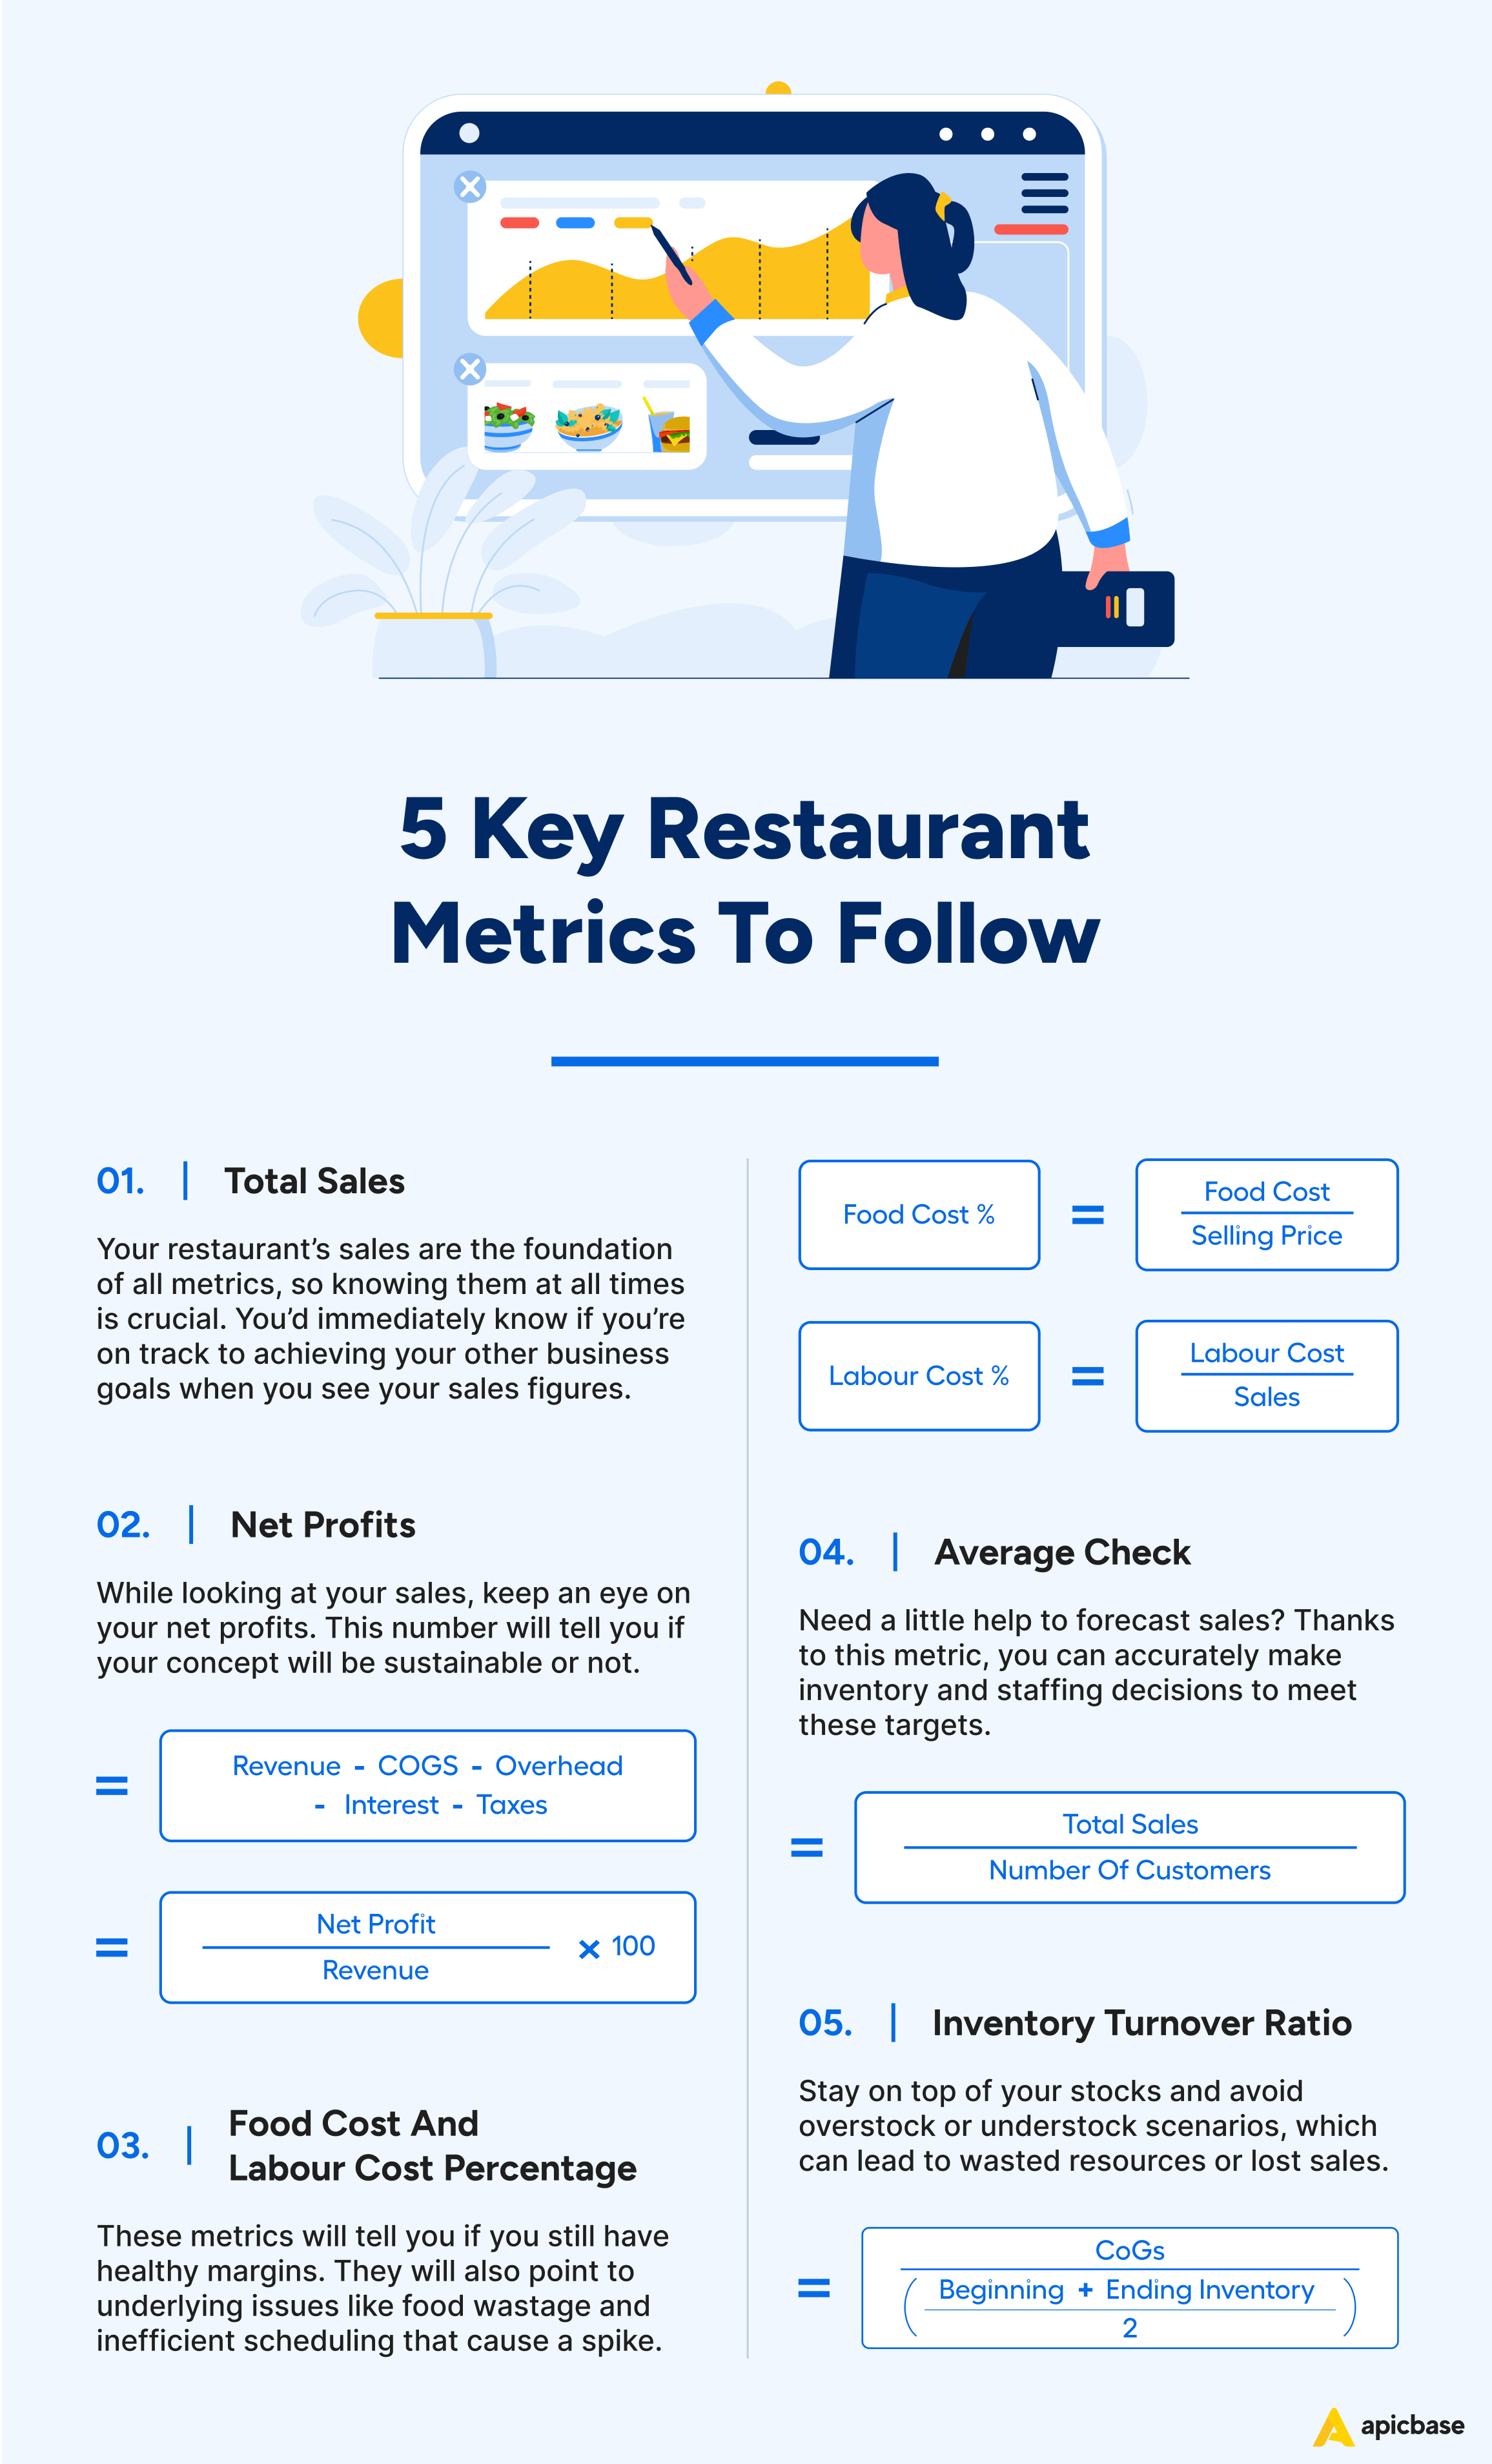
1. Total Sales
Your restaurant’s sales are the foundation of all metrics, so knowing them at all times is crucial. You’d immediately know if you’re on track to achieving your other business goals when you see your sales figures.
2. Net Profits
Knowing your restaurant sales isn’t enough. At the end of the day, it’s the net profits that counts. You don’t want your business to consistently rake in huge sales, only to see them drained away. So while looking at your sales, keep an eye on your net profits. This is the real number that will tell you if your concept will be sustainable or not.
3. Food Cost and labour Cost Percentage
To ensure that your restaurant will meet its target net profits, you should consistently monitor your food cost and labour cost percentage. These metrics will tell you if you still have healthy margins. They will also point to underlying issues like food wastage and inefficient scheduling that cause a spike in these numbers.
4. Average Check & Average Customer Headcount
Looking at the average check and average customer headcount will help you forecast sales so you can accurately make inventory and staffing decisions to meet these targets. Accurate sales forecasting is essential in every restaurant businesses so you can maximize your resources while reducing waste.
5. Inventory Turnover Ratio
Tracking and managing inventory is crucial for any business to become successful and profitable. With inventory turnover ratio, you can stay on top of your stocks and avoid overstock or understock scenarios, which can lead to wasted resources or lost sales.
Additionally, this metric will quickly point out inefficiencies in your system, so you can address them early.
Depending on your business goals, you can measure other restaurant metrics than these five. If your goal is to develop brand loyalty, you can measure Customer Retention Rate and Average Rating Score per Customer. These metrics will let you determine how your customers perceive your business, so you can give them more of what they want.
If your goal is to improve employee morale, you can measure sales per labour hour to identify employees you can incentivize or employee turnover rate to gauge the success of your employee engagement activities.
Are you tired of manually tracking your restaurant metrics?
Managing a successful food business requires regular number crunching – but it doesn’t have to be a chore.
Discover Apicbase’s restaurant analytics software, your solution to automated data capturing. No more manual entry or calculation errors.
Here’s what Apicbase can do for you:
- Automatically pulls data from essential sources like your Point of Sale (POS) system and suppliers.
- Calculates and presents your metrics in clear, easy-to-understand dashboards.
- Enables quick and confident decision-making.