
MRM EXCLUSIVE: Consumer Data Analytics Reveal Dining Patterns to Attract Customers
4 Min Read By Thérèse Mulvey
The last few years have not been easy for several key industries in the U.S., including restaurants. According to CNN, there are fewer U.S. restaurants today than in 2019 and it is not clear when —if ever — they’re coming back. In 2022, there were about 631,000 restaurants in the United States. That’s roughly 72,000 fewer than in 2019.
More closures in 2023 could reduce the number of restaurants to about 630,000 locations. Restaurant research firm Technomic says they don’t foresee the number of restaurants in the U.S. returning to pre-COVID levels even by 2026.
With those stats in mind, Causeway Solutions conducted consumer research* on today’s dining trends compared to our research over the past few years.
Remember 2020? At that time, we used our online survey* of U.S. Adults 18+ to ask how COVID was impacting people’s comfort levels with eating out. Only 34 percent said they were comfortable eating out at a restaurant, which translates to more than 60 percent being uncomfortable eating out. By 2021 we asked the question a little differently and found 22 percent of consumers said they were currently eating out but 16 percent still said they would not until the pandemic ended.
With the COVID impacts behind us, people are back in restaurants but as the CNN article stated, it is different. In August 2023, only eight percent of consumers we surveyed say they do not eat out, so dining out is “in” again.
In Causeway Solutions’ September 2023 survey*, we asked more than 800 U.S. Adults 18+ specific questions not only about eating out but also what type of restaurant and how often.
When asked if they were dining out tonight:
- 30 percent said they would choose a chain restaurant.
- 62 percent said they would choose a local restaurant.
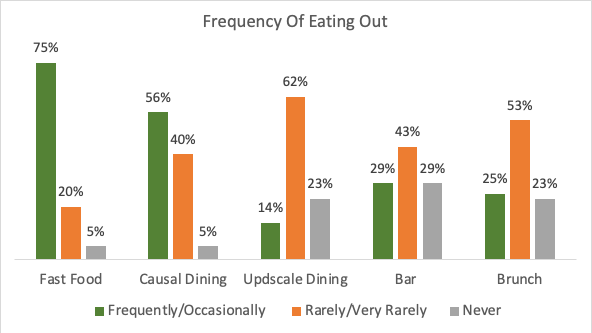
When we asked about fast food:
- 29 percent said they eat fast food frequently.
- 46 percent said they occasionally dine at a fast-food restaurant.
- Only five percent said they never eat fast food.
For casual dining habits at restaurants like Olive Garden:
- 56 percent said they ate at casual restaurants frequently or occasionally.
- 29 percent said they rarely ate at casual restaurants.
- Only five percent said they never went to such an establishment.
Bar type restaurants such as Buffalo Wild Wings had a much higher “never” rating at 29 percent.
For fine dining such as Morton’s or Ruth’s Chris:
- Only 14 percent frequently or occasionally eat at fine dining restaurants.
- 62 percent rarely or very rarely enjoy fine dining.
- 23 percent said they never dine at this type of establishment.
Source: *Causeway Solutions 2023
Dining Out and Household Spending
Now that we know a little bit about overall dining habits, we looked at how people’s feelings and attitudes about other things influence their dining preferences. For example, we asked people if they are doing more or less household spending this month compared to last month to see if that influenced their dining patterns.
Those who say they are spending more are also likely to eat out at fast food restaurants frequently, but for all other dining questions they are very similar to the average adult.
The bigger difference is for those who spend less. They reflect that frugality with their restaurant visits and are less likely to frequent both casual and upscale dining establishments in general.
Travel and Dining Habits
Next, we looked at travel preferences and how that relates to dining, and we found some interesting patterns. When asked if “over the past three months they have taken a weekend getaway,” 22 percent said yes.
When we further profiled “the weekenders,” compared to the general population, they are:
- More likely to eat at local restaurants.
- Less likely to frequent fast food.
- More likely to occasionally eat at casual restaurants.
- Much more likely to occasionally eat at an upscale dining place.
Demographics Impacting Dining Out
So, who are these people who are eating out?
Not surprisingly, 51 percent of those who said they do not eat out fall into the lowest income category, with household income $50,000 or less, compared to 31 percent of the population. Parents show the opposite, as only 6 percent of those who said they never eat out are parents.
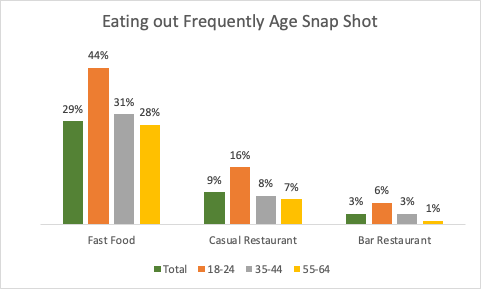
For age profiles:
- 34 percent of frequent bar diners are 18-34 compared to only 22 percent of the population, and 58 percent of the people who never visit are 55+.
- For casual dining, the largest percentage of frequent visitors (44 percent) are 25-44, compared to 36 percent of the population.
- Upscale diners are 35-54 making up 70 percent of those who say they eat there frequently. Only 26 percent of the population is 35-54.
Source: *Causeway Solutions 2023
As restaurateurs recover from the economic impact of COVID-19 and inflation, they don’t want to be caught off guard. “While the fallout of the pandemic transformed restaurants, the industry is seeing a need to continue innovating and adapting. Overall, restaurants are aiming to do more with less,” says Lisa Fong, Head of Product, Square for Restaurants.
Nearly a third of restaurants (29 percent) are considering raising prices. However, 88 percent of consumers say they’d understand if their favorite local business raised its prices due to inflation and rising costs of goods. More than half of consumers (55 percent) said they would tolerate a one – ten percent price increase.
Restaurants need to know their audience to ensure they’re catering to the people who are most likely to visit, while minimizing wasted advertising dollars. Working with a data analytics partner who has expertise in predictive and prescriptive modeling and acquisition analytics, restauranteurs can get the consumer insights they need, serve up the most appealing menu, and satisfy the appetite of their ideal customers.
Causeway Solutions has conducted a monthly online survey of U.S. Adults 18+ for more than 3 years. The data offers snapshots into consumer attitudes and behaviors, which support industry trends. Insights include optimism about the economy, plan to purchase and media usage. Causeway Solutions offers key industry profiles, including healthcare, entertainment, sports, travel, restaurants and more. The most recent survey was conducted September 9-13, 2023, with 838 Adults 18+ completing the online questionnaire.