
Surgical Pricing Strategies: How QSRs Can Navigate Inflation
2 Min Read By Jana Zschieschang
Has consumer dining behavior returned to pre-pandemic levels? Many standard indices say yes.
While it’s understandable to believe everything is back to normal – according to our QSR monthly trends, August 2023 traffic was down just half a percent compared to 2022 – the landscape has taken a seismic shift.
Using the QSR traffic and sales data Revenue Management Solutions (RMS) has been gathering for 25-plus years, our analysts recently completed an exhaustive comparison of pre and post-pandemic data, comparing the first two quarters of 2022 and 2023 to the same period in 2019.
The differences are drastic. For example, we noted above that in August 2023, YOY traffic was holding steady. Since 2019, however, QSR traffic has been down nearly 20% (18.4 percent) and trending downward since January 2022, when it was just 15.5 percent lower than 2019.
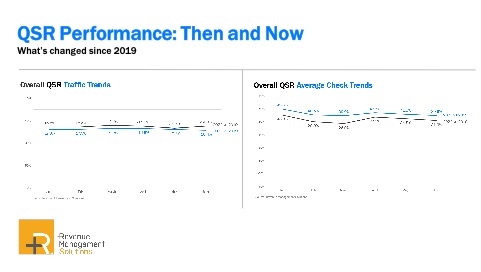
Also startling is the change in the QSR average check. Comparing YOY, the average check is up just seven percent. But cumulatively, the average check of a QSR trip is 40 percent higher than pre-pandemic, and, in some dayparts, it is up 51 percent.
The data also suggests some permanent shifts in consumer behavior. Dine-in is down an average of almost 50 percent compared to 2019. Lunch traffic is consistently down by about 20 percent, likely due to hybrid work, and breakfast traffic has started to decline in 2023 compared to pre-pandemic performance.
Today’s customers are likelier to work from home – and love the drive-thru. They are also growing weary of inflation.
What does all this tell us? Today’s customers are likelier to work from home – and love the drive-thru. They are also growing weary of inflation. When we asked consumers about restaurant spending, 31 percent said they were spending less on restaurants, and most (55 percent) spent less by ordering from restaurants less frequently.
The data also supports what RMS has been advising: pricing must be strategic.
Here’s how we’ve been advising our clients:
- Leverage Item sensitivities. Insights from transactional POS data specific to locations and customer segments can help operators assess where item sensitivities are low or high, indicating which items might have further pricing opportunities and which don’t.
- Avoid across-the-board price increases. Instead, we recommend focusing on the item level and keeping increases small, spread over an extended period. Also, consider co-purchases (items frequently bought together) and bundles, and avoid pricing customers out of their comfort range.
- Stay informed about where your menu prices fit with the competition. Tracking industry and competitor pricing tactics can help you uncover pricing opportunities or further market share opportunities for your brand.
- Optimize what’s working — the drive-thru. Among all revenue channels, drive-thru has delivered the best overall net sales, with an average increase of 24.95 percent in FH 2023 compared to FH 2019. There are several ways to make the most of this channel, some relatively straightforward, starting with leveraging your menu board and incorporating technology. Consider suggestive selling, displaying a specially designed drive-thru menu with fewer items and bigger images, with the most profitable and easily assembled items placed at eye level. Drive-thru-specific bundles and value meals also remain a tried-and-true strategy.
As we head into the last quarter of 2023, operators will need to continue adapting to a new landscape and do so with precision and data. Combined, this approach will undoubtedly help restaurants enter 2024 stronger.