
March 16, 2021
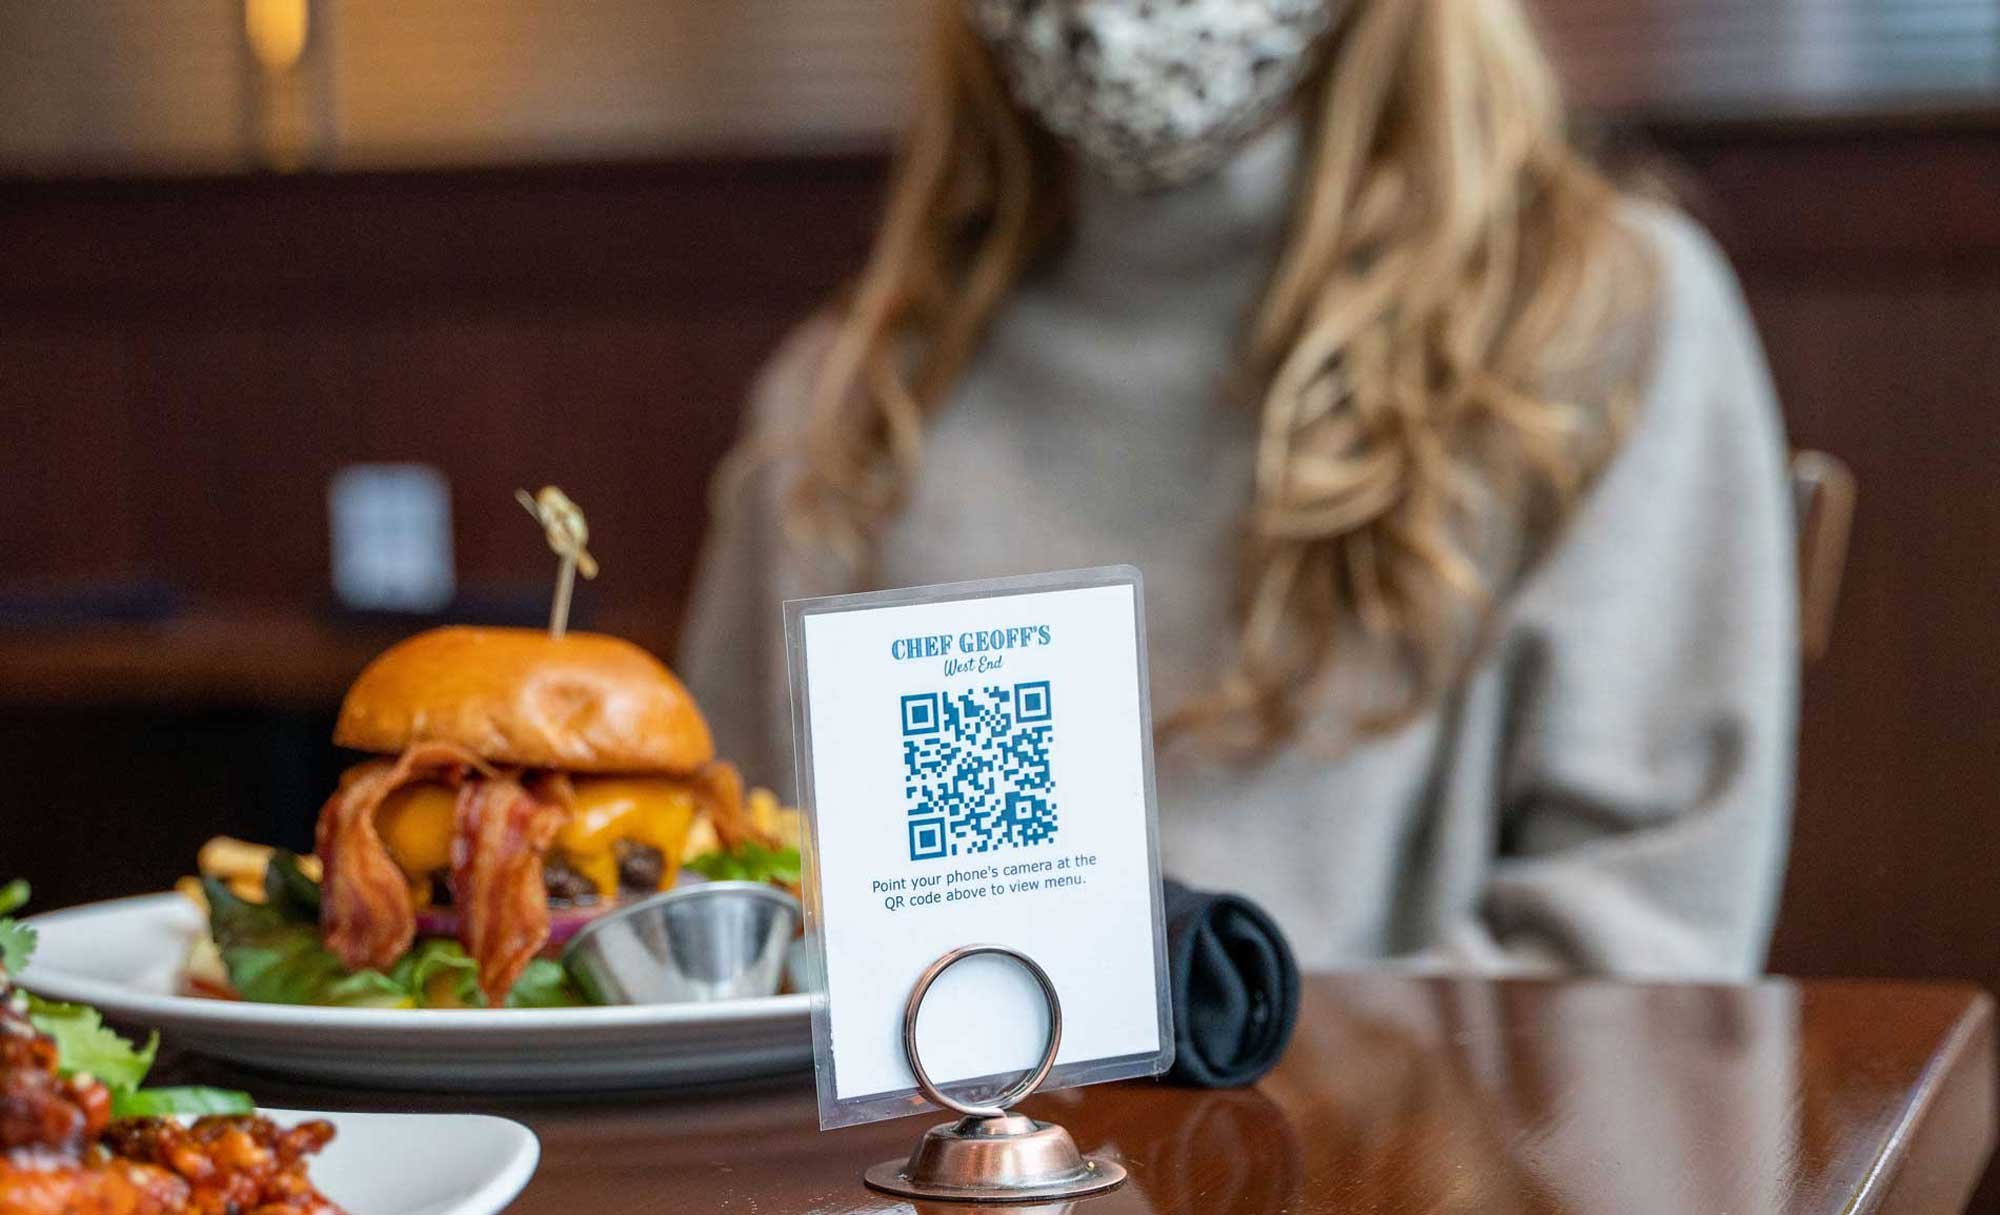
Chef Geoff’s, Chef Geoff’s Restaurant Group, Metro Washington DC
It’s the anniversary of the onset of Covid-19 lockdowns and the resulting damage to businesses across the country. Hard to name another industry that fell with the same immediacy or severity as the restaurant industry.
After an unprecedented and unparalleled crash, restaurants have clawed their way back up – taking steps forward, getting pushed backwards – but ultimately beginning to close the vast gap between Covid-era sales and 2019 sales.
Plus, restaurant sales are no longer just coming from customers dining on-site. Third-party delivery apps have invented a whole new sales channel for restaurants, and the pandemic has officially put it into play – going from about 7% of restaurant sales to almost a third of sales in just one month. Delivery has been a life-line for restaurants, but we expect the long term impacts of this type of revenue sharing to be unsustainable.
How much damage was done to this industry, largely comprised of small businesses crucial to our communities? What kind of restaurants have fared the best? The worst? What’s the future of restaurants’ relationships with third-party delivery apps?
Here’s the story, as told by the data.
All Restaurant Sales
2020 was predicted to be an incredible year for restaurants – in fact, for the almost 2,000 restaurants in our dataset, sales were up an average of 5.43% compared to the first two months of 2019. In this (now comical) report from February 27th 2020, the National Restaurant Association projected grossing a record $899 billion in 2020.
Chef Geoff’s, Chef Geoff’s Restaurant Group, Metro Washington DC
Cue the pandemic lockdowns and accompanying freefall of restaurant sales.
Restaurants crossed the 0% year-over-year sales line on March 10, 2020 and hit a rock bottom of -66.36% year-over-year sales on March 21st. While the restaurant industry has faced recessions – this kind of plummet had never been seen or imagined. Given the restaurant industry makes up 4% of our GDP, that drop in sales annualized works out to be a 2.6% hit to GDP.
Other industries with in-person services like hotels, movie theatres, and gyms followed a similar course. In Q2, the economy contracted at a 31.4% pace, the worst the government has seen since keeping records. The S&P 500 fell 28% between February 19, 2020 and March 25, 2020.
After falling out of the sunny skies of January and February 2020, the restaurant community dusted themselves off and reimagined what dining looks like in a pandemic. Their creativity, combined with restrictions loosening, learning more about how the virus actually spreads, and warmer weather pushed sales back up as we headed into summer and fall. Three months after the rock-bottom day (March 21 2020), on June 21 2020, the 7-day moving average of restaurant sales was -26.46% and six months after, September 21 2020, restaurant sales made it to -17.59% on a 7-day moving average.
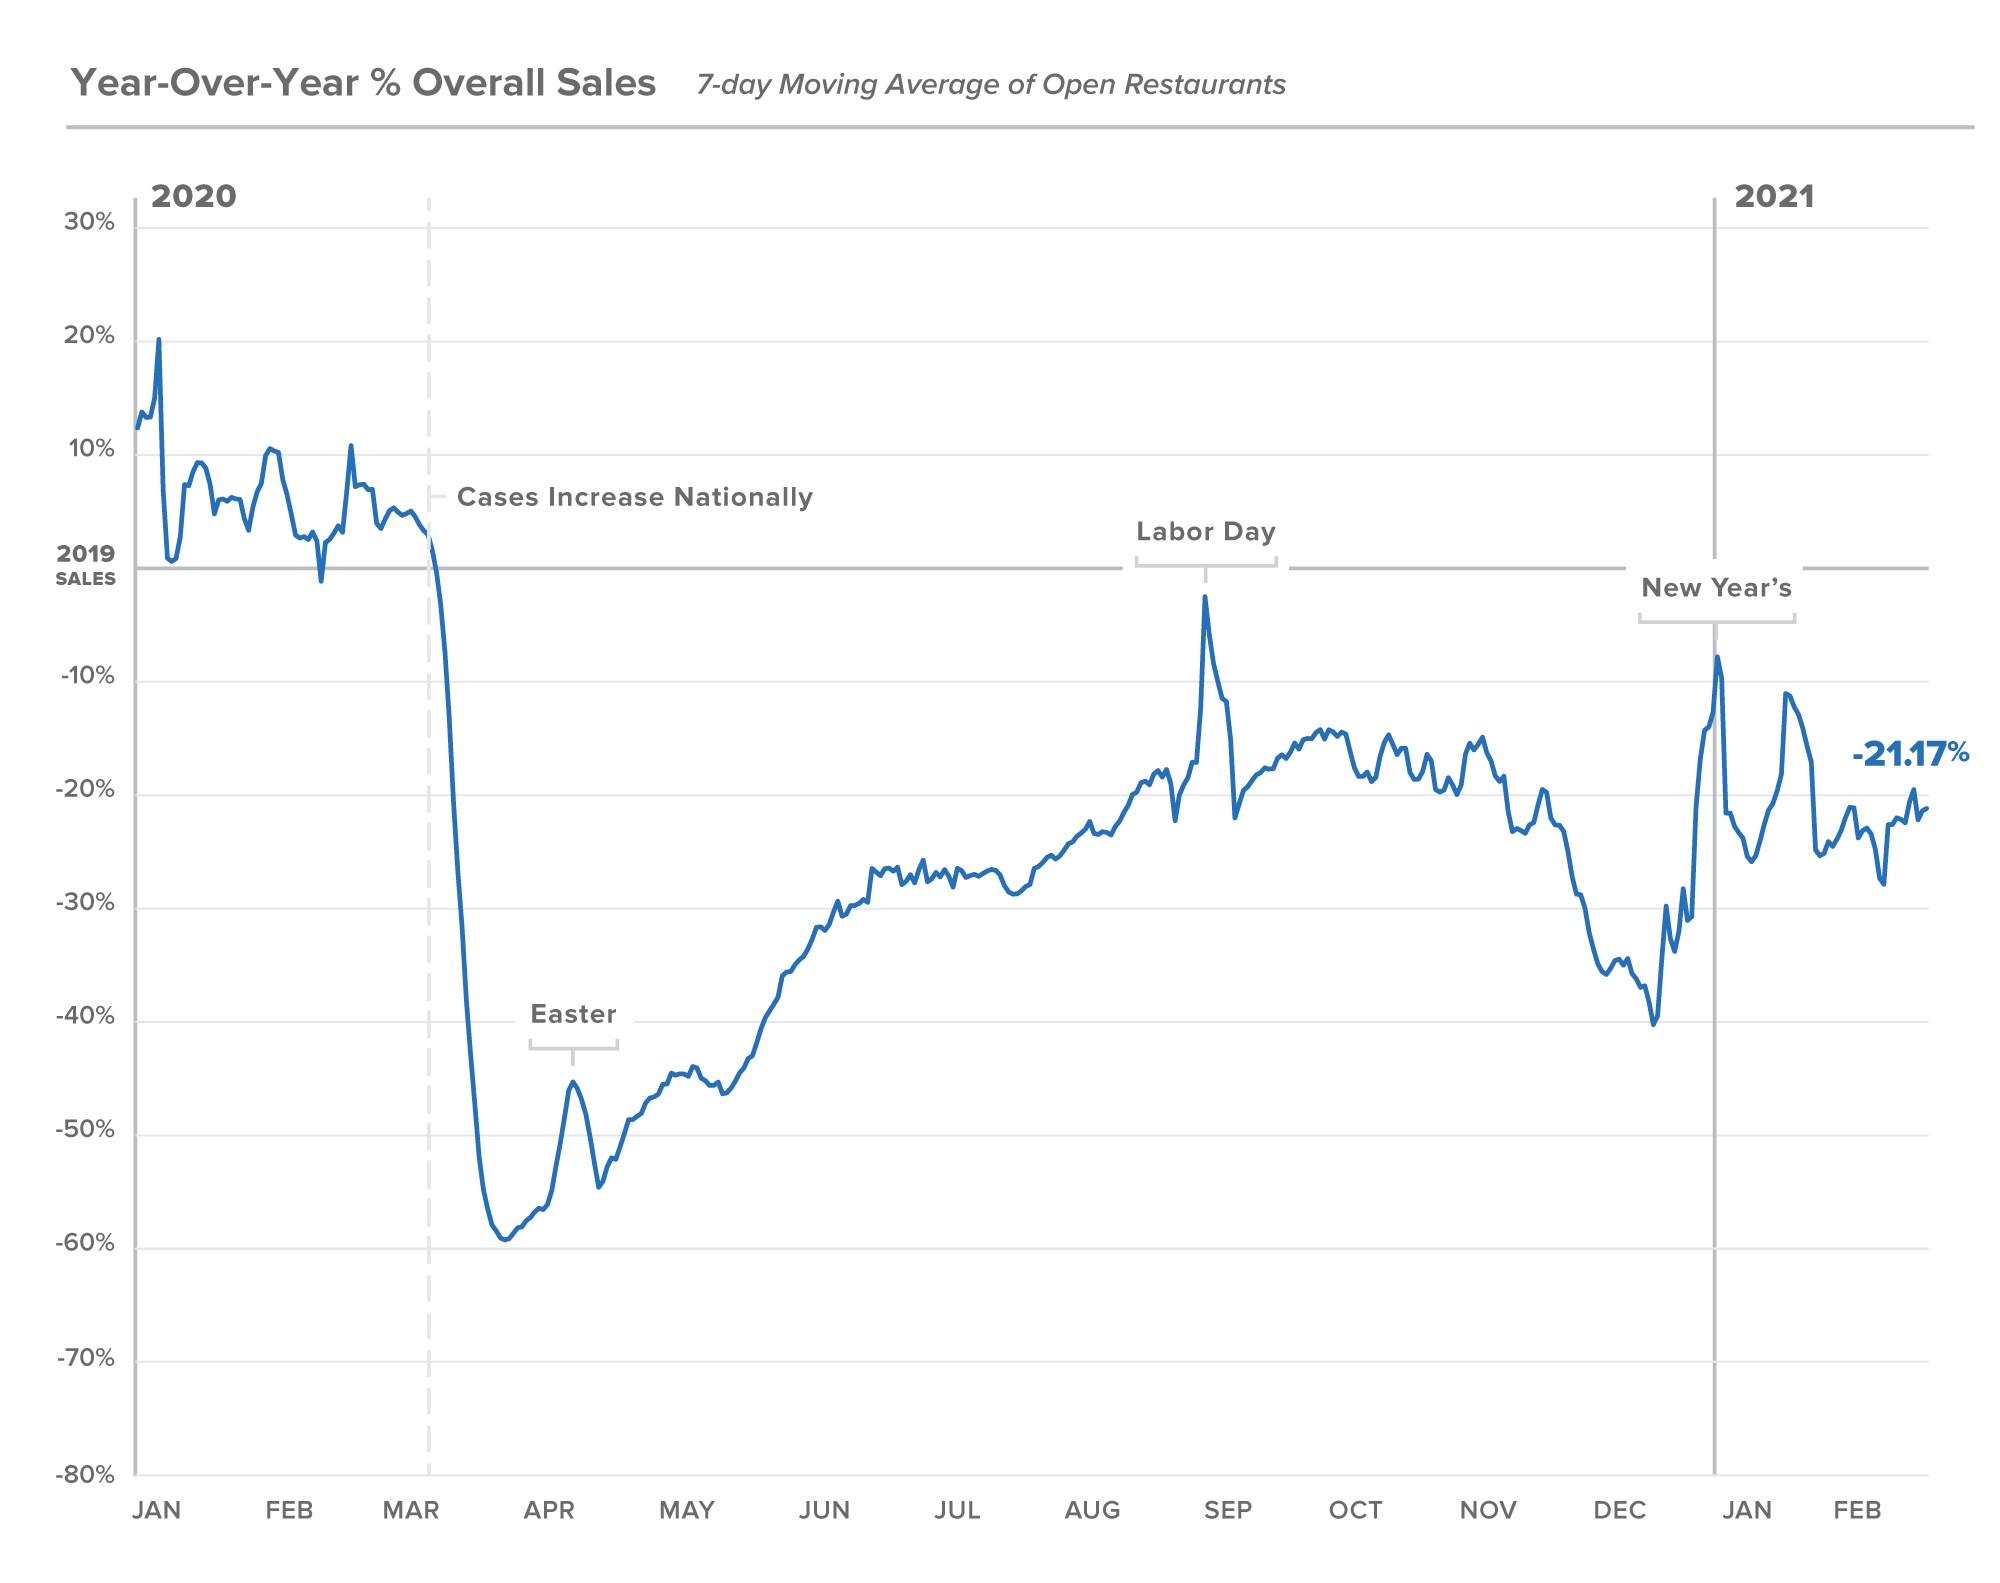
Note on graph: These are year-over-year sales for open restaurants; we’ve excluded any restaurants that have closed. Each data point represents a 7 day moving average of the 7 days prior.
Fast Casual vs. Full Service Sales
The initial effects of the lockdowns were felt differently between the two main types of restaurants, full service restaurants (with servers) and fast casual restaurants (without servers). This makes sense given fast-casual restaurants are better positioned for delivery – the food typically travels better, it’s less expensive so there’s more room for delivery fees, and the ambiance of a fast-casual restaurant is less essential to the experience consumers pay for.
As a result, the worst sales day for fast-casual was -61.13% of year-over-year sales and full-service restaurants kept sinking down to -83.78% of year-over-year sales.
While Full Service has never caught up to Fast Casual trend lines, they substantially narrowed the gap during the summer months as indoor dining became allowed in many places around the country and as the restaurants operationalized outdoor dining.
The roll out of $34 billion in PPP funding allotted to the restaurant industry allowed Full Service restaurants to staff up in spite of dramatically reduced sales and relief dollars were put towards more creative changes to make dining viable in the pandemic.
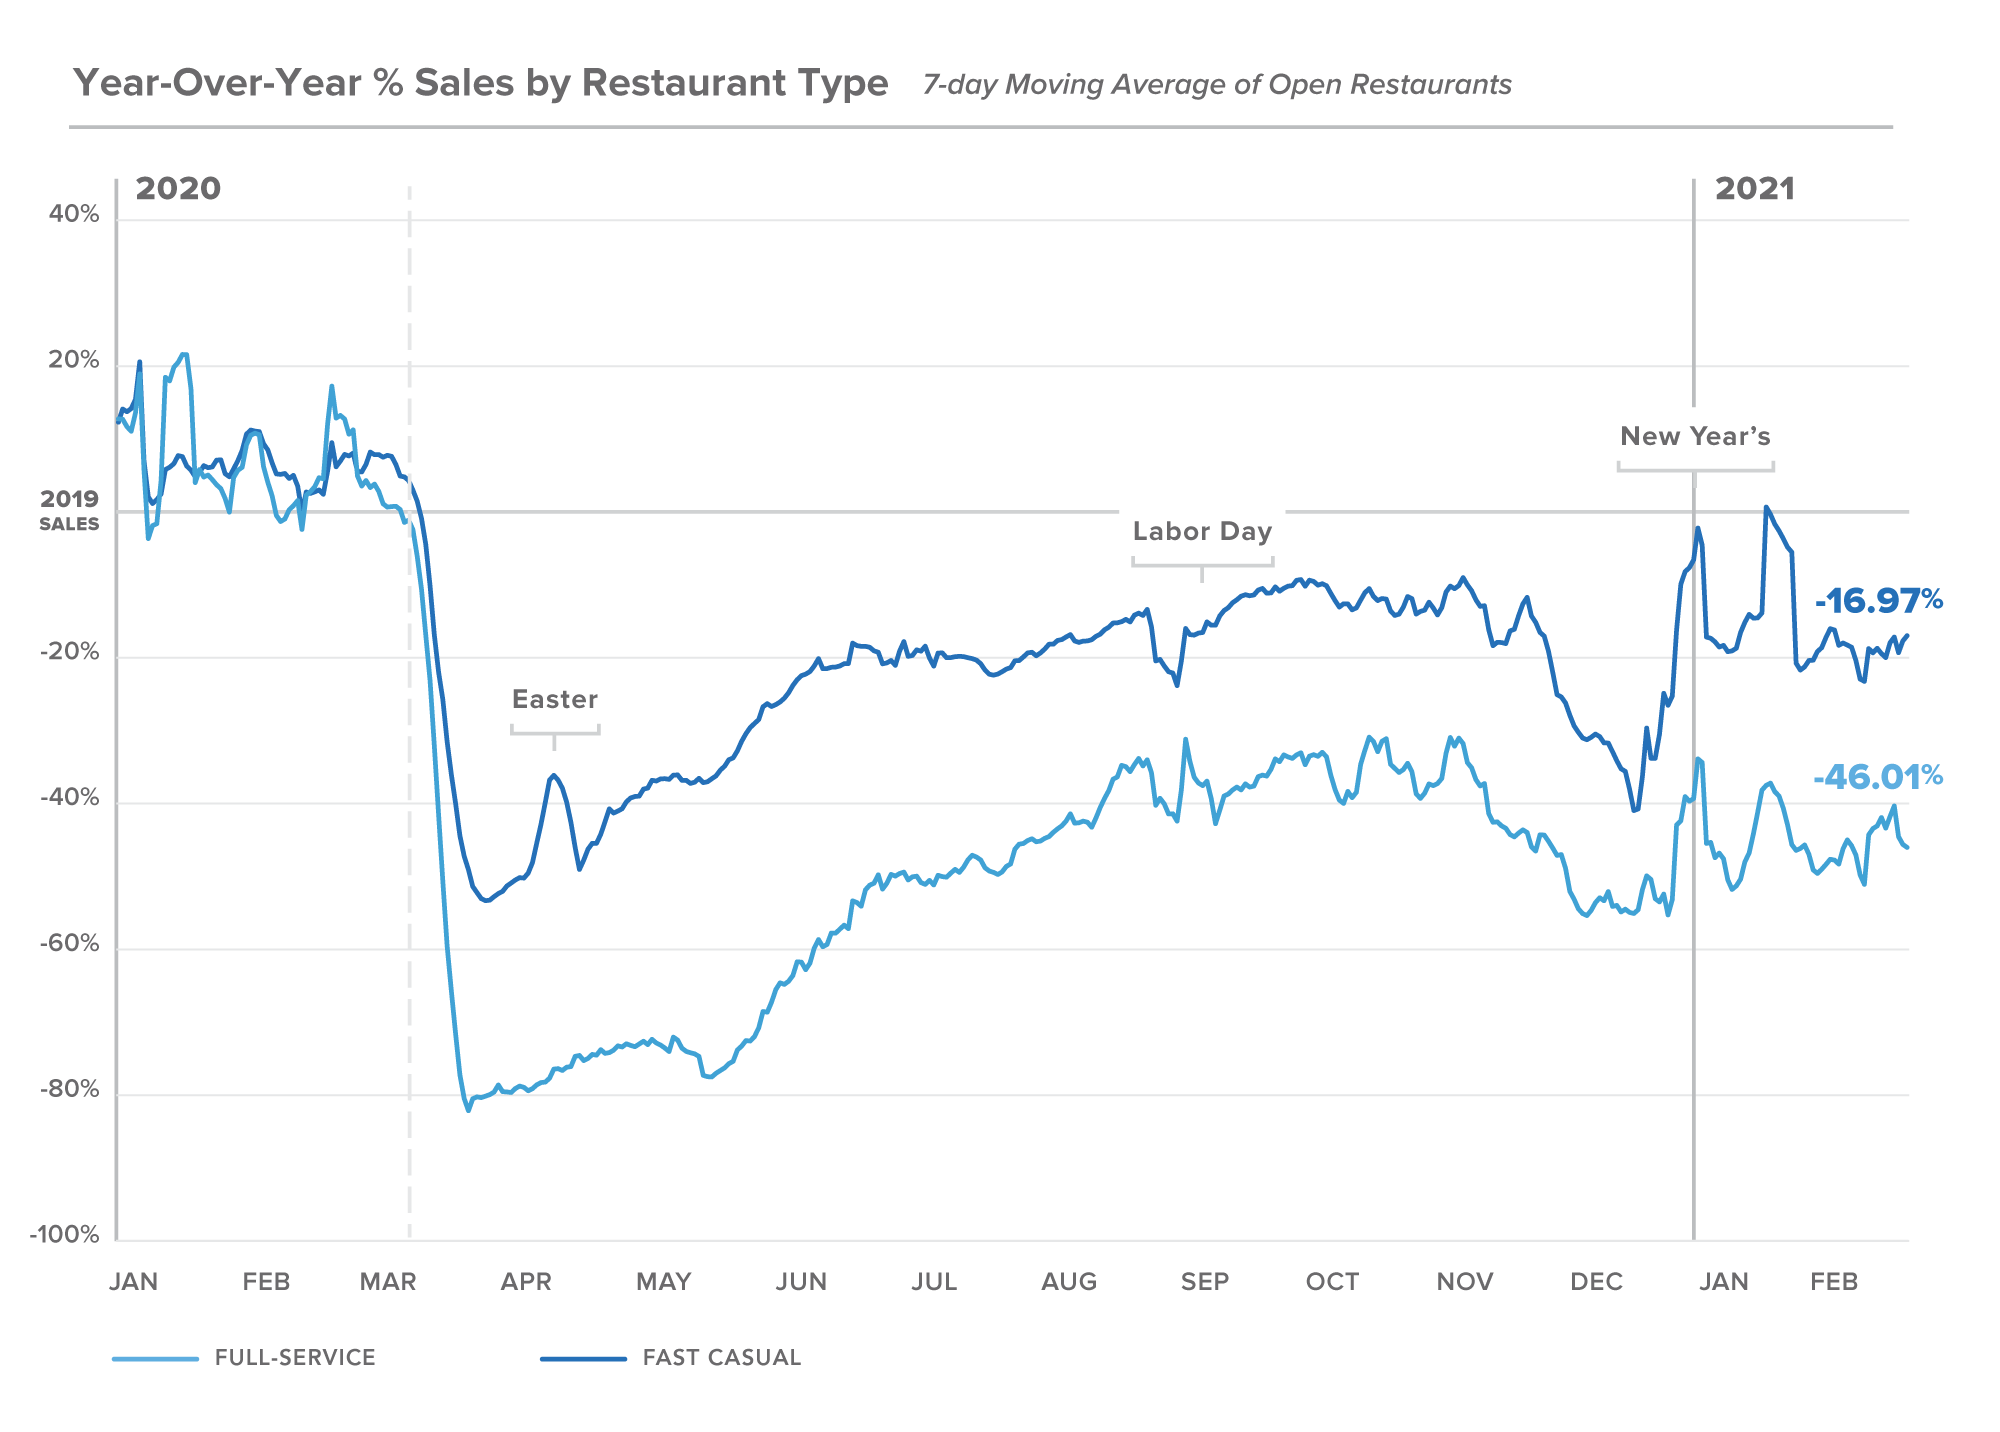
Note on graph: These are the 7 day moving average of year over year sales of open restaurants, divided into two groups: fast-casual and full-service.
Regional Sales
One of the most volatile trends we examined were viewed through the regional lens. This visual demonstrates not only how differently each region navigated this crisis but the dramatic and immediate effects that were felt by restaurants every time local guidance was changed.
Over the fall months we saw each region coalesce around -15% year over year, buoyed by outdoor dining and loosened restrictions but as case counts began to rise again, the ripple effects of local restrictions played out differently for each region. The South was largely buffered by weather impacts and looser restrictions and the newly rebounding Northeast region reflects their recent steps toward reopening.
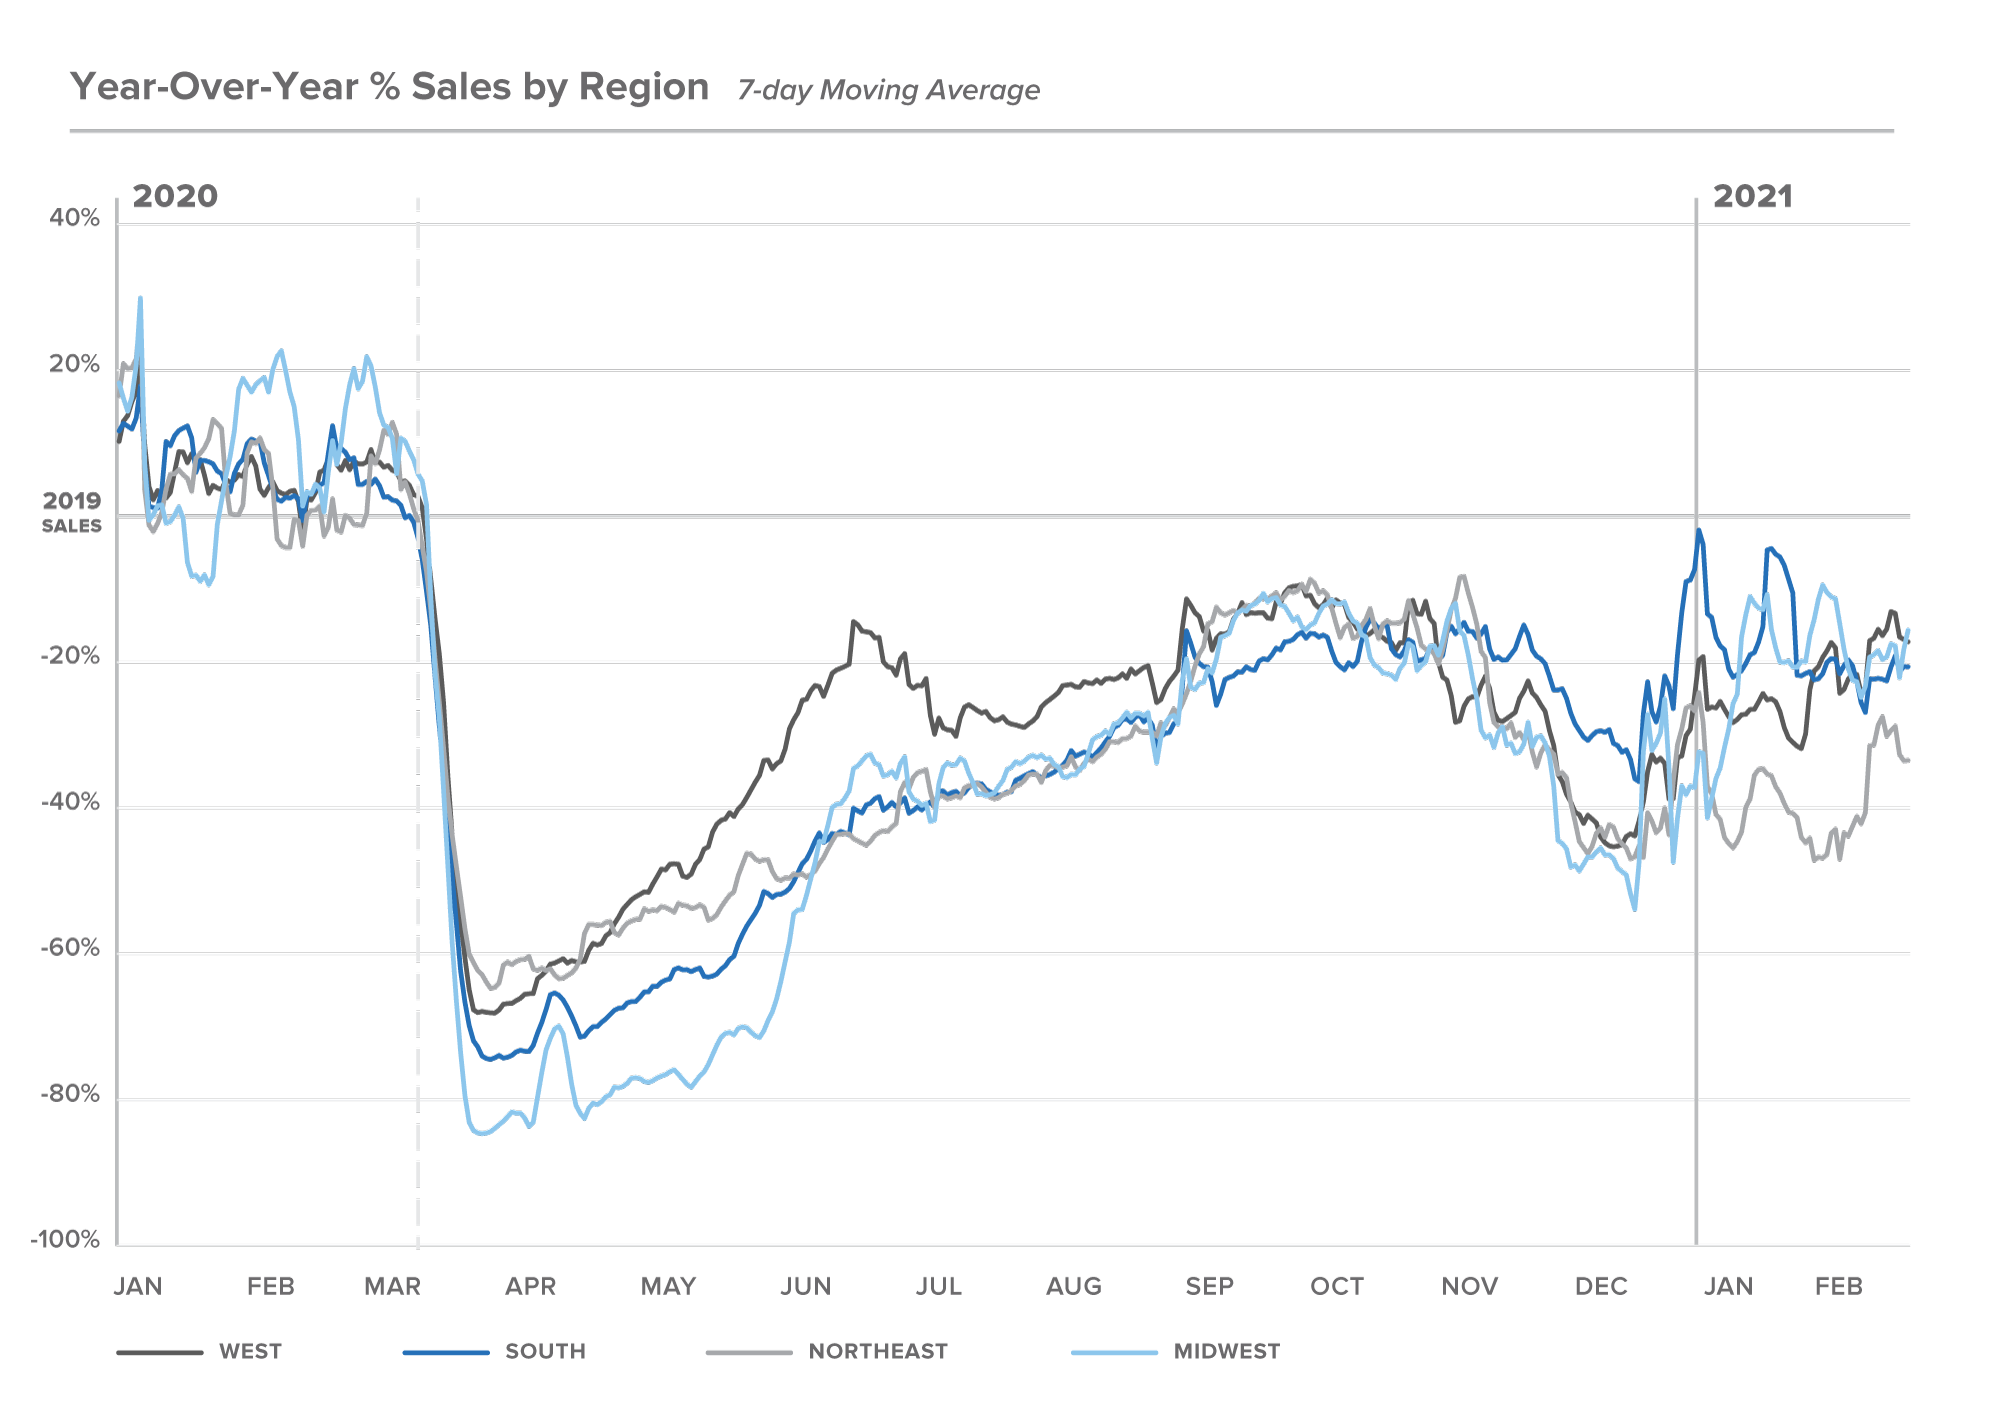
Note on graph: These are the 7 day moving average year-over-year sales of open restaurants divided into regions. We’ve assigned a region based on the zip code of the restaurant’s operating location.
Delivery Sales
Unfortunately not all revenue sources are the same for restaurants. When food is not ordered on premise, third-party delivery companies want a share of the sale for configuring the logistics of getting the food to the consumer. Eater cites these delivery “partners” often charge 20 to 30 percent of the sale – painful to restaurants who already operate on thin margins. Before the pandemic, when third-party delivery app sales represented about 7% of a restaurant’s total sales, this was frustrating to restaurant’s but doable – but when almost a third of sales came from this source, it was crippling to restaurants. In fact, in response, several US cities like New York City and Los Angeles, capped fees at 15 percent during the pandemic.
While we expect delivery proportions to decrease as dining becomes more and more viable, we don’t predict the share will return to pre-pandemic single digit levels. It will continue to be important for restaurants to navigate sustainable relationships with delivery partners and we hope to see more industry born solutions like DC ToGoGo and others offer more sustainable options to restaurants.
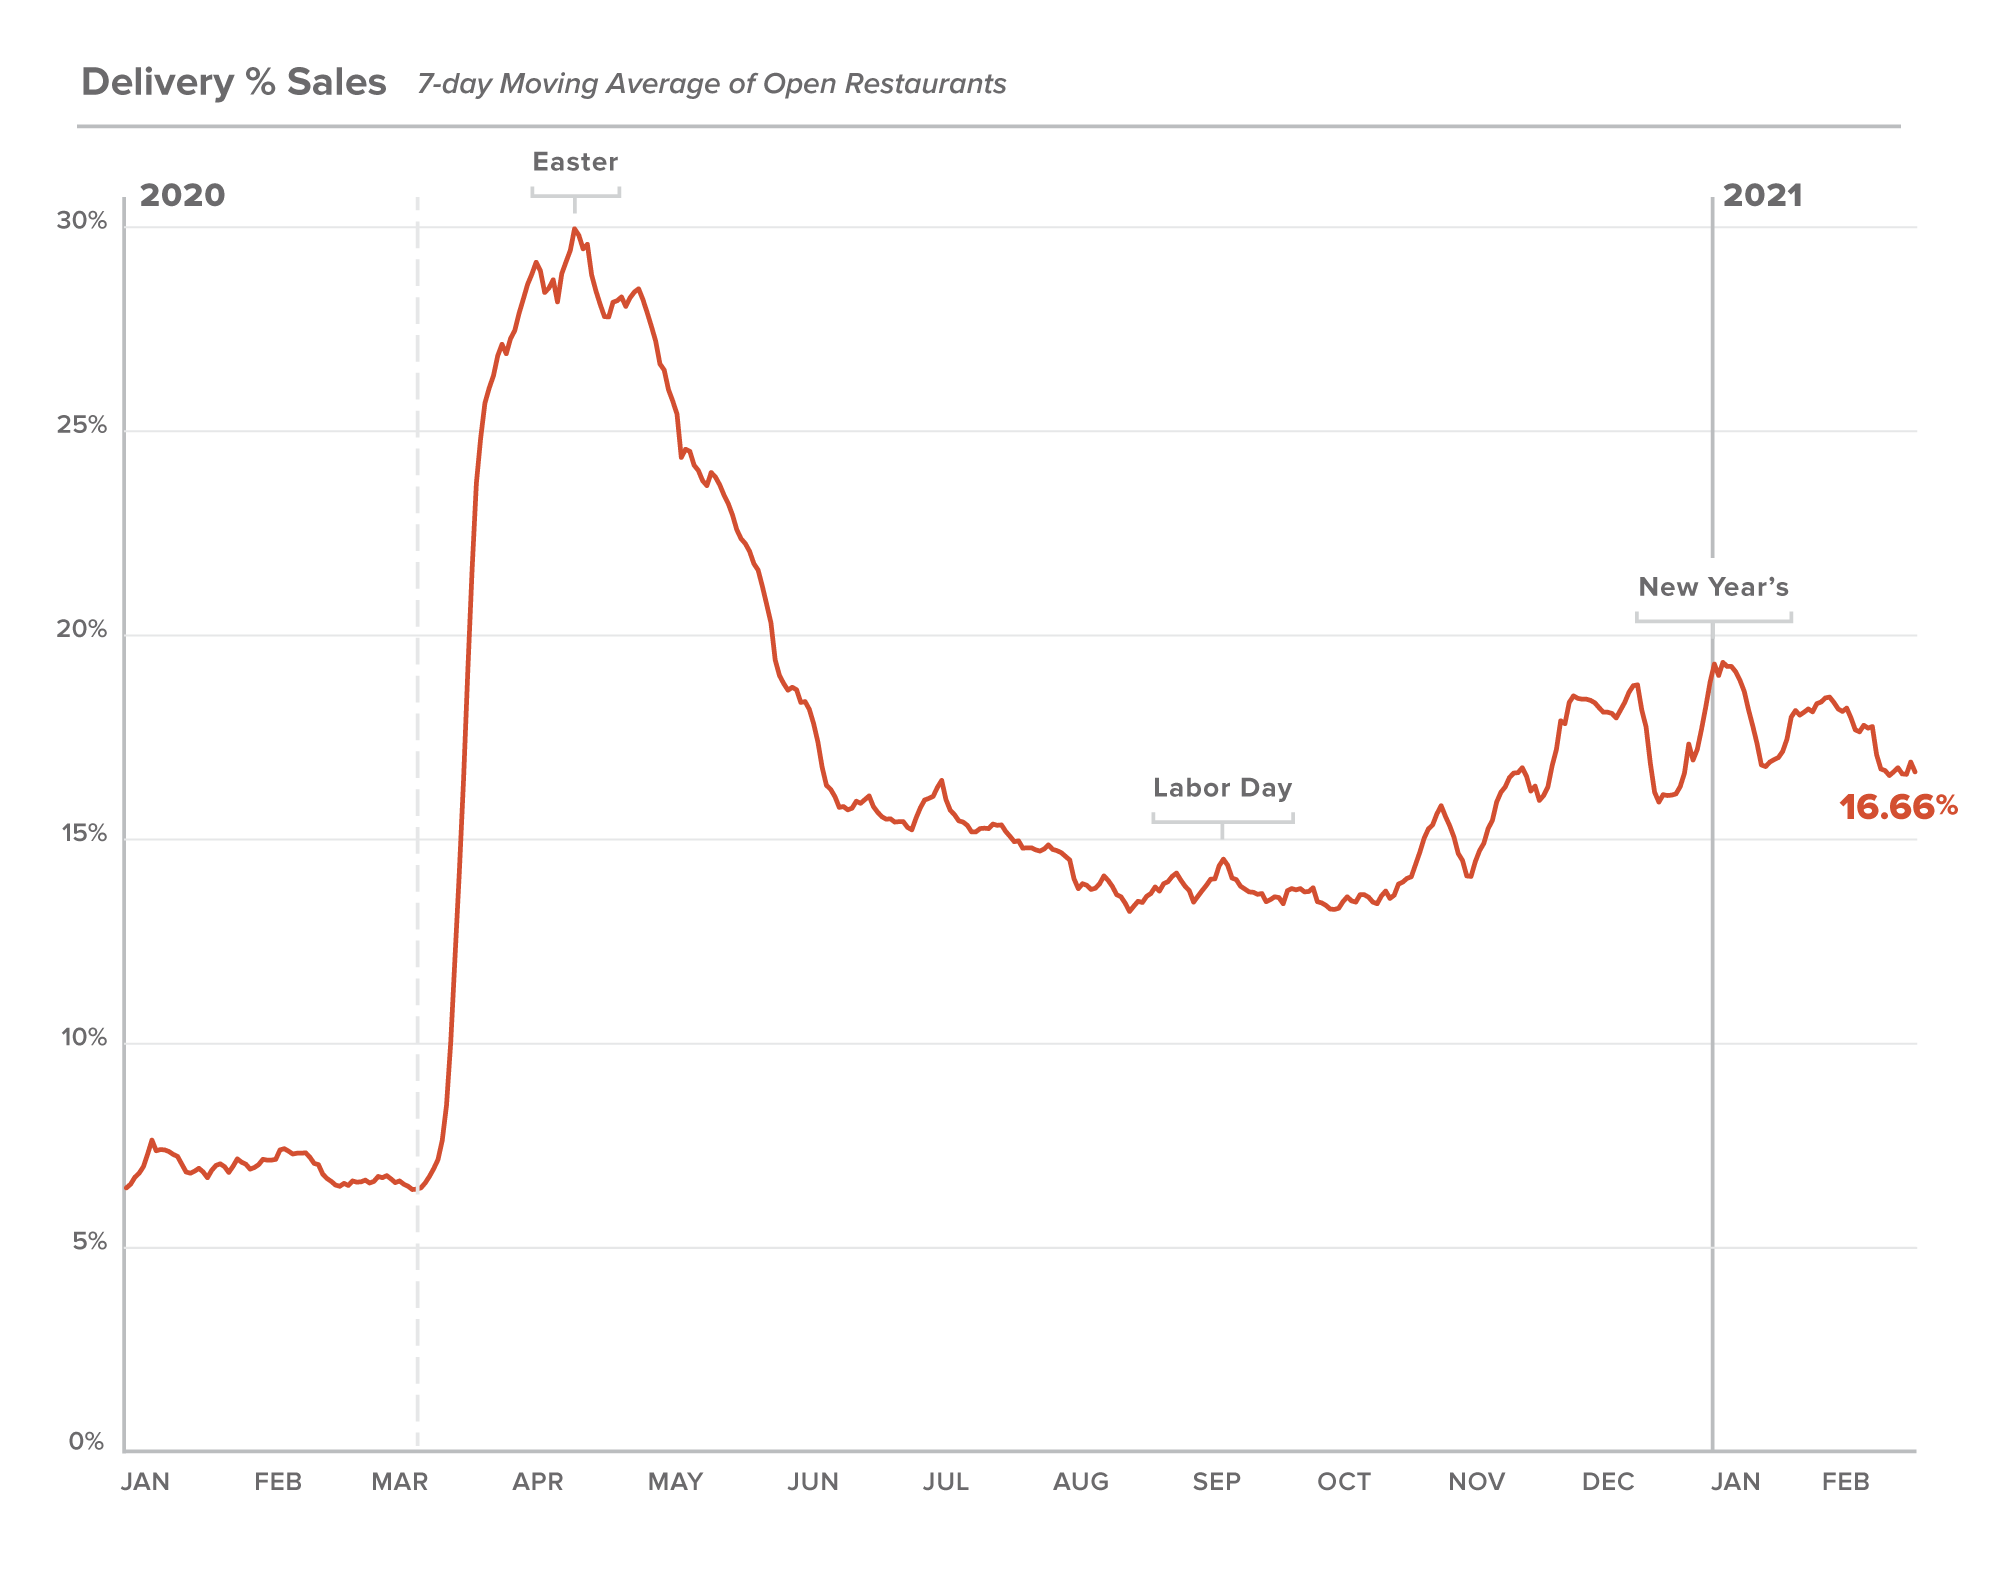
Note on graph: This is the percentage of restaurant sales coming through a third-party delivery app. Each data point represents a 7-day moving average of the 7 days prior.
Wrap Up
Open Road Grill, Metropolitan Restaurant Group, Metro Washington DC
This report tells us a lot about trends, but to us the anchoring message conveyed in these metrics is the sheer grit, determination, and resilience of our restaurants. This year proved what those in the industry already knew – that restaurants are critical and essential cultural anchors in our communities, and that the tough-as-nails operators who run them are some of the most creative, tough, and resilient people in the world.
We have never been prouder to work in – and to serve – the restaurant industry, and we are bullishly optimistic about their path ahead.
About MarginEdge
MarginEdge is a software for restaurants looking to streamline back of house functions and increase visibility into daily financial and operational reporting. We work with almost 2,000 restaurants around the US, from fast-casual to fine dining. You can learn more about our solutions here.
Tag(s):
Industry Trends