MRM Research Roundup: End-of-June 2021 Edition
26 Min Read By MRM Staff
In this edition of MRM Research Roundup, we feature top foods of 2021, customer satisfaction, the Good Food 100 and shopping sentiments,
State of the Plate
As we approach a new normal and restaurants reopen, there's a lot to look forward to for the rest of the year. Before looking ahead, let's rewind to see how diners ate their way through the last six months. Grubhub launched the third annual "State of the Plate" report. Looking at trends from hundreds of thousands average daily orders, Grubhub's mid-year report checks in on what has shaped 2021 thus far, including the top trending foods, popular restaurants across the country, and what we can expect to see more of in the second half of the year.
Top Foods
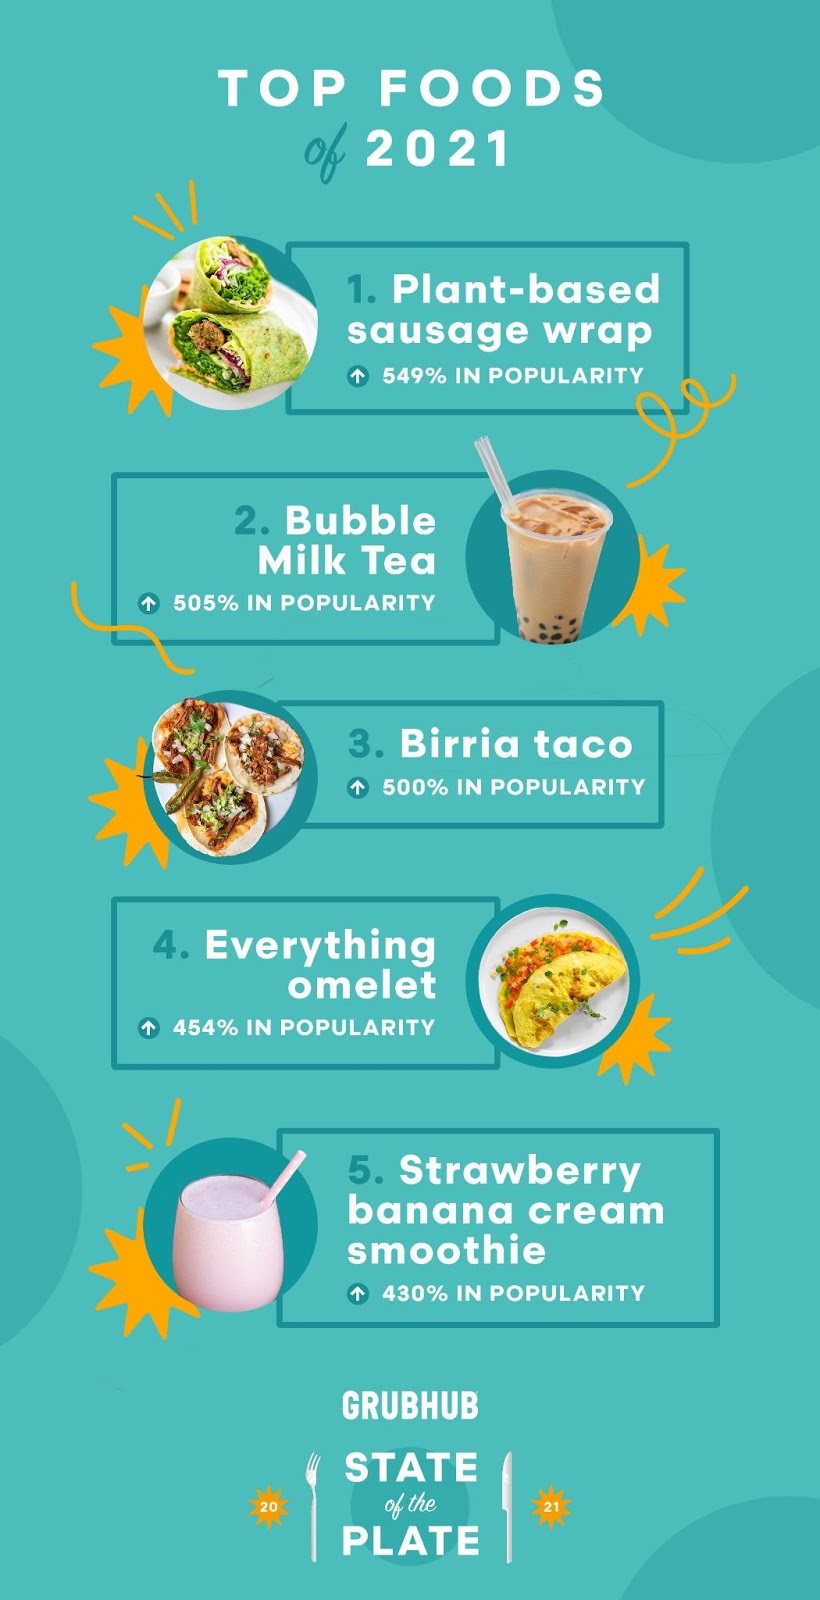
Unlike 2020, diners opted for the plant-based versions of delivery classics so far in 2021. And while last year's top food, the wildly popular spicy chicken sandwich, didn't make the list, the Nashville hot chicken sandwich still made the top 10.
- Plant-based sausage wrap: (+549 percent)
- Bubble milk tea: (+505 percent)
- Birria taco: (+500 percent)
- Everything omelet: (+454 percent)
- Strawberry banana cream smoothie (+430 percent)
- Spicy miso tonkotsu ramen: (354 percent)
- Churro waffle: (+339 percent)
- Beef empanada: (+333 percent)
- Nashville hot chicken sandwich: (+327 percent)
- Korean barbecue cauliflower wing: (+302 percent)
Disclaimer: The top foods below have seen the fastest growth on the Grubhub platform during the first half of 2021.
Top Side Dishes
- Cajun fries: (+630 percent)
- Red beans and rice: (+612 percent)
- Corn chowder: (+603 percent)
- Jalapeno bites: (+465 percent)
- Biscuits and gravy: (+368 percent)
- Top Desserts: Pies and chocolate are a recurring theme in the dessert category.
- Chocolate french silk pie: (+698 percent)
- Cinnamon apple pie: (+584 percent)
- Frozen custard: (+486 percent)
- Cookies & cream milkshake: (+458 percent)
- Peanut butter & hot fudge sundae: (+423 percent)
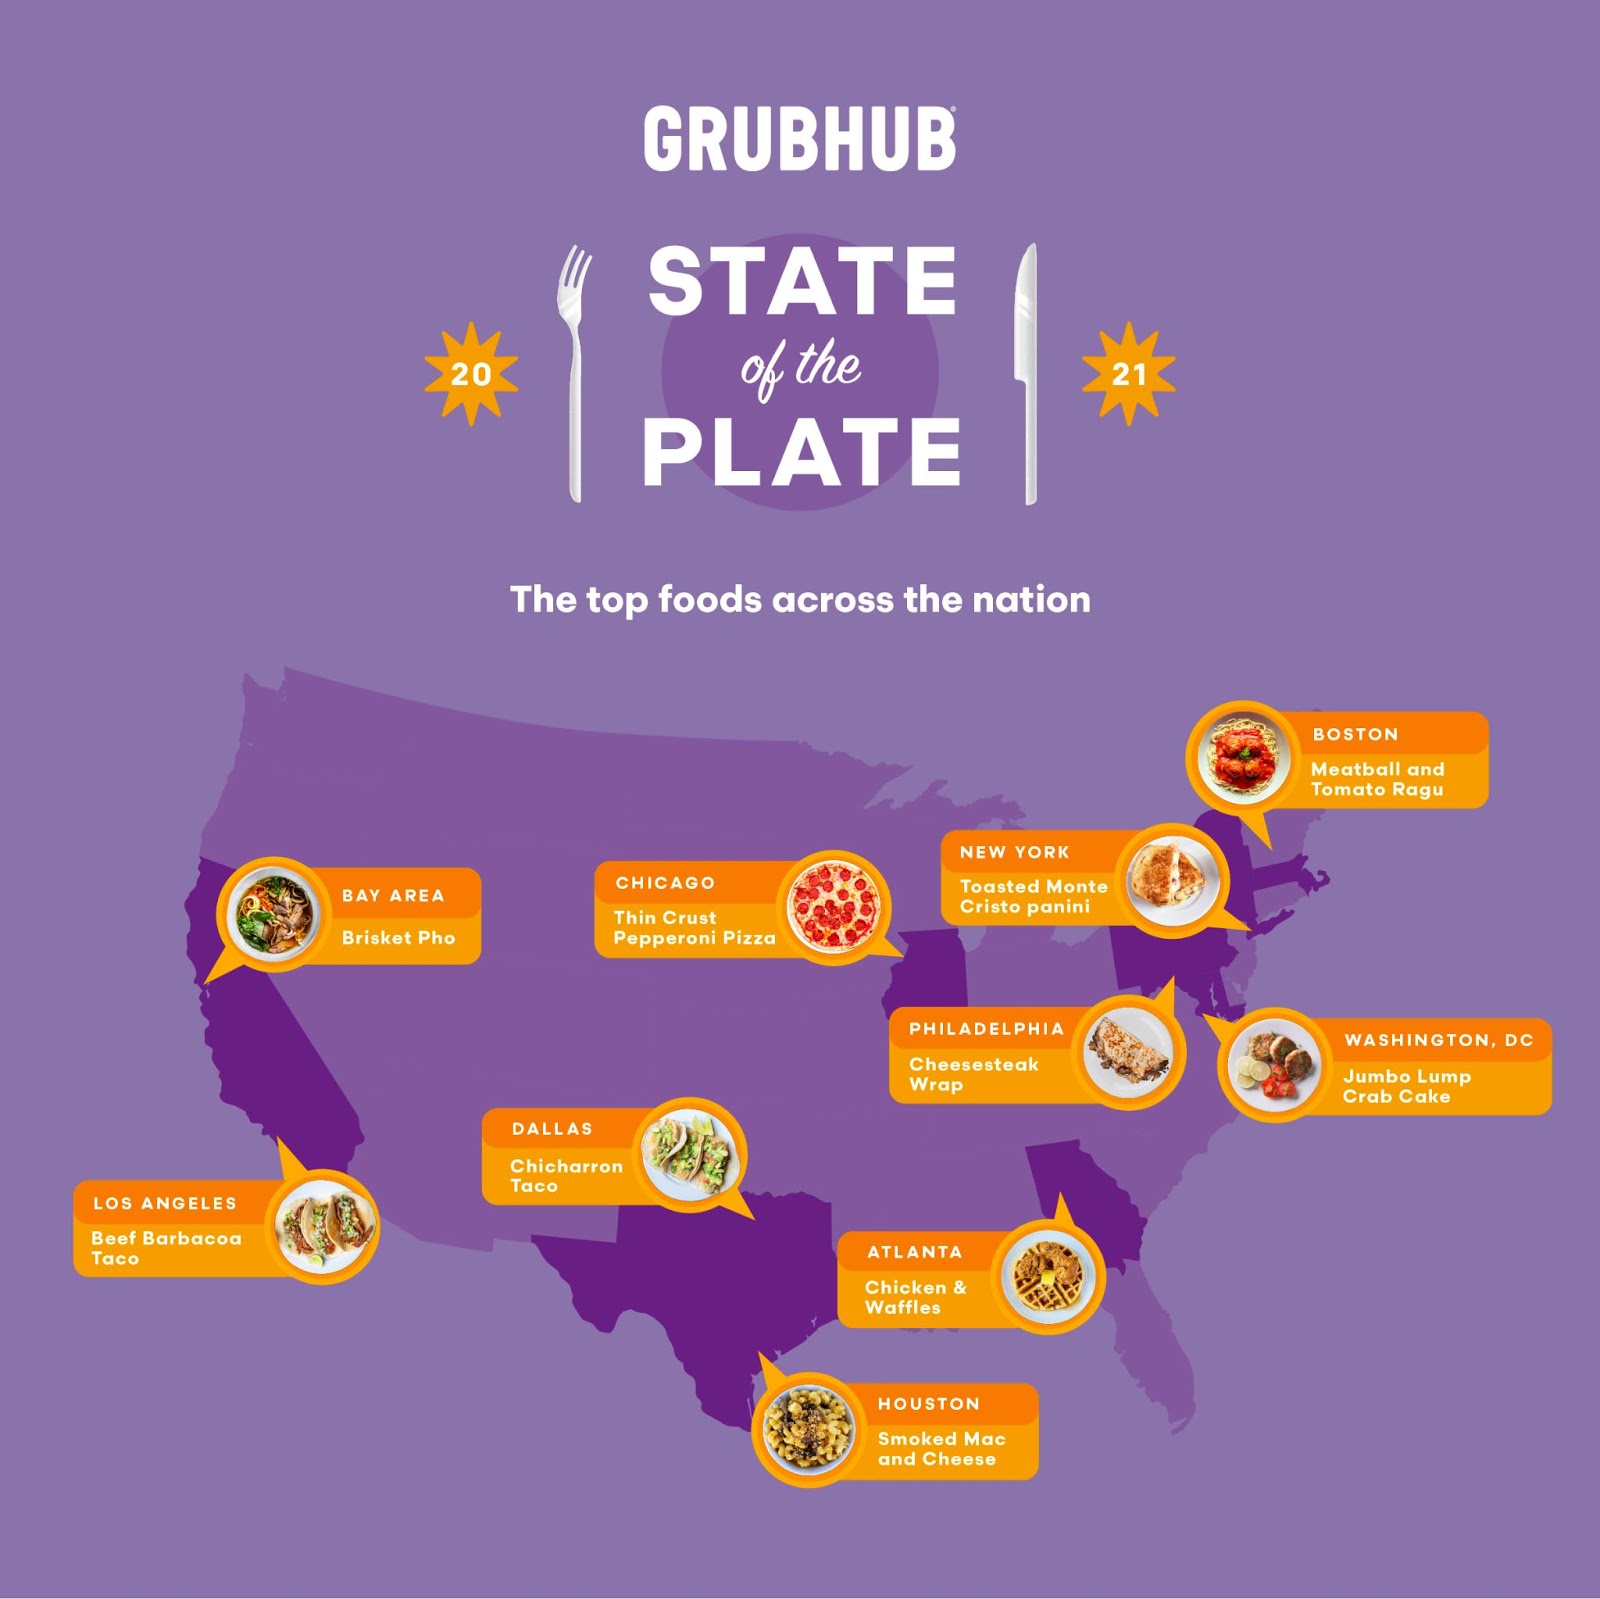
Top Foods Across Major Markets
Look close enough and it's clear that 2021 brought some twists on local favorites (we're looking at you, Chicago and Philadelphia).
New York City: Toasted Monte Cristo panini (+691 percent)
Los Angeles: Beef barbacoa taco (+686 percent)
Chicago: Thin crust pepperoni pizza (+694 percent)
Philadelphia: Cheesesteak wrap (+694 percent)
Dallas-Fort Worth: Chicharron taco (+690 percent)
Houston: Smoked mac and cheese (+592 percent)
Boston: Meatball and tomato ragu (+689 percent)
Atlanta: Chicken & waffles (+532 percent)
Bay Area (SF, San Jose, Oakland): Brisket pho (+697 percent)
Washington D.C.: Jumbo lump crab cake (+562 percent)
Restaurants Rising in Popularity
From bagels to pizza and everything in between, Grubhub looked at various factors, including overall orders, reorder rates, and ratings, to find some of the most popular restaurants across the country.
- Knickerbocker Bagel – 367 Knickerbocker Ave, Brooklyn, NY 11237
- Eagle Trading Company – 258 Franklin St, Brooklyn, NY 11222
- Oregon Steaks – 2654 S 10th St, Philadelphia, PA 19148
- A Baked Joint – 430 K St NW Washington, DC 20001
- John's Pizzeria Ristorante & Lounge – 2104 N Western Ave, Chicago, IL 60647
- The Dough Co. – 1337 Hilyard St, Eugene, OR 97401
- El Taconazo El Tio – 3529 W Fullerton Ave. Chicago, IL 60647
- El Maguey – 901 E. Nifong Blvd, Columbia, MO 65201
- Thai Thani – 2021 NW Market St B, Seattle, WA 98107
- Hanaya Poke – 675 E 2100 S Ste B, Salt Lake City, UT 84106
Vegan & Plant Based
Like we saw in Grubhub's 2020 Year in Food Report, diners continue to eat plant-based, but the pace has slowed down a bit compared to previous years. So far this year, vegan orders have risen by 17 percent, plant-based burgers specifically increasing by 28 percent, and general vegetarian orders by a whopping 55 percent!
Top Vegan Orders
- Plant-based sausage wrap: (+549 percent)
- Barbecue cauliflower wing: (+302 percent)
- Mushroom & tofu broth ramen: (+299 percent)
- Sauteed string bean + garlic: (+264 percent)
- Grilled vegetable hummus bowl: (+242 percent)
Top Cities for Vegans
- Los Angeles, CA
- New York City, NY
- Portland, OR
- Miami, FL
- Philadelphia, PA
Top Alcohol Orders
The pandemic allowed more restaurants across the country to deliver alcoholic beverages, and that trend continued into 2021. Diners jumped on board with the top orders ranging from light beer, tropical cocktails, and a brunch favorite.
- Dutch lager
- Hot sake
- Japanese beer
- Hibiscus margarita
- Blood orange margarita
- Aperol spritz
- Hard seltzer
- Peach Paloma
- Pina colada
- Mimosa
Seasonal Favorites
The weather tends to affect our eating habits, so we looked at which orders rose the most this past winter and spring. We expect a mix of hot and cold food orders to trend during the summer months and desserts during the fall months with one obvious go-to flavor.
Top Trends: Winter
- Short rib rigatoni: (+270 percent)
- corned beef and cabbage: (+219 percent)
- Butternut squash soup: (+154 percent)
- Grilled chicken avocado sandwich: (+131 percent)
- Chicken dum biryani: (+124 percent)
Top Trends: Spring
- Margherita pizza: (+283 percent)
- Strawberry lemonade freeze: (+210 percent)
- Peanut butter sundae: (+194 percent)
- Spicy chicken sandwich: (+165 percent)
- Chicken bacon ranch melt" (+154 percent)
Forecasts: Summer (in ranking order)
- Loaded chicken nachos
- Barbecue pork quesadilla
- Watermelon slushy
- Strawberry shortcake sundae
- Heirloom tomato salad
Forecasts: Fall (in ranking order)
- Vegan mapo tofu
- Truffle mushroom swiss burger
- Raspberry cheesecake
- Cookie & cream milkshake
- Pumpkin cupcake
Top Trends Across Meal Times
Breakfast: Acai bowls dropped from #1 to #3, while morning drinks made the list this year.
- Mocha iced coffee: (+351 percent)
- Chorizo breakfast burrito: (+318 percent)
- Acai bowl: (+297 percent)
- Mango pineapple smoothie: (+207 percent)
- Shrimp & grits: (+178 percent)
Lunch: Thai chicken salads take the #1 spot for the second consecutive year.
- Thai chicken salad: (+324 percent)
- Chicken pot pie soup: (+278 percent)
- Chicken pesto sandwich: (+261 percent)
- Strawberry poppyseed salad and chicken: (+202 percent)
- Caribbean jerk chicken wrap: (+198 percent)
Dinner: Indian-inspired foods continue to be a favorite for dinner.
- Vegetable samosa: (+260 percent)
- Hawaiian teriyaki chicken skewers: (+247 percent)
- Eel avocado roll: (+244 percent)
- Tandoori chicken: (+220 percent)
- Seaweed salad: (+215 percent)
Late-night: Comfort foods and sweet desserts dominate late-night food orders.
- Pizza puff: (+294 percent)
- Strawberry cheesecake: (+269 percent)
- Buffalo chicken pizza: (+244 percent)
- Buffalo wings: (+234 percent)
- Hot fudge sundae: (+209 percent)
Getting Out and About
Most people are returning to “out and about” behaviors — RMS just completed its sixth quarterly survey since the pandemic began. This one, fielded May 25-28, 2021 included 805 respondents and seems to be a good indicator of future behavior. We’re happy to write up something for you, or do a deeper dive. Just let me know!
First off, nearly 60 percent of respondents are fully vaccinated – a big jump from 17 percent in February 2021 when we last surveyed.
Despite that, some pandemic behaviors are still sticking around. Consistent to what we reported last quarter, a majority of respondents report no change in restaurant visit frequency at breakfast, lunch OR dinner, and the percentage reporting the "same" behaviors increased even since Feb. 2021.
That said, we are seeing some changes across consumer behaviors.
- 11 percent reported going back to an office or workplace.
- Respondents that reported dining in at least once a week increased by 20 percent, led by Gen X and Boomers. In total, 62 percent reported dining out at least 1x a week in this most recent survey.
- When they do go out, consumers prefer local restaurants over national chains; QSR more than fast casual or casual dining; and coffee shops/casual eateries are preferred over "breakfast only" spots.
- Price sensitivity has increased, as have concerns over the economy and our own personal finances.
The economic impact of the pandemic and having the "financial means to feed my family" went up substantially in the total ranking of household concerns. “Economic impact of the pandemic” now ranks 2nd in household concerns, up from #4; while "financial means" ranks 4th, up from #7. Concern over infection has, obviously, gone done in the rankings.
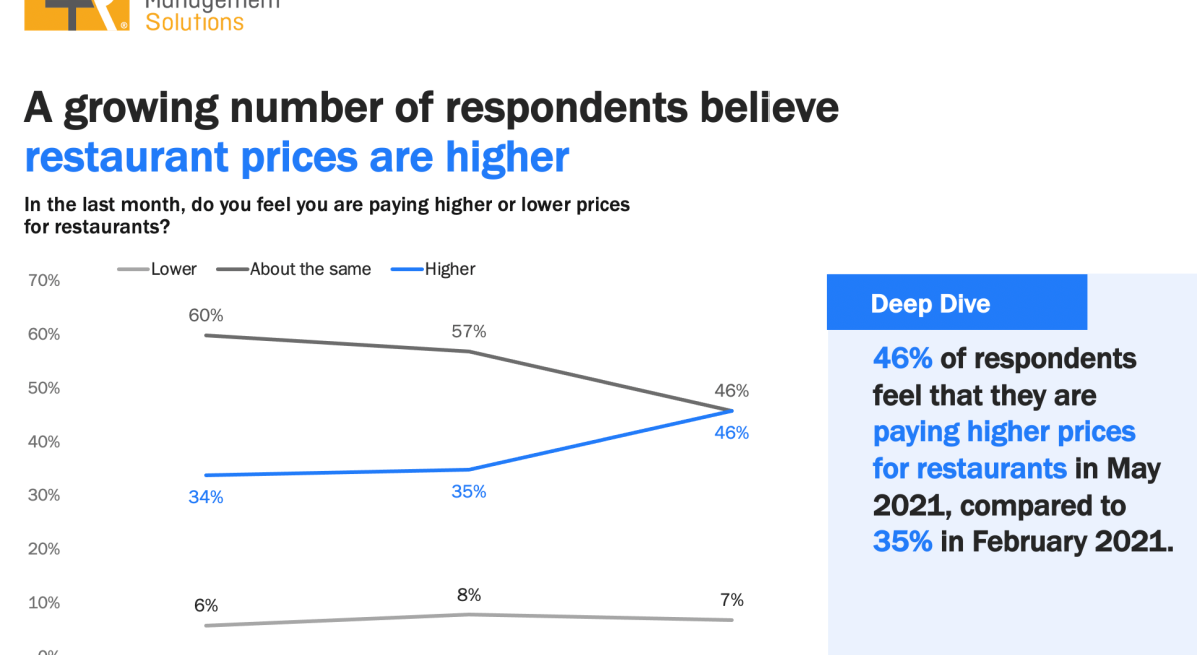
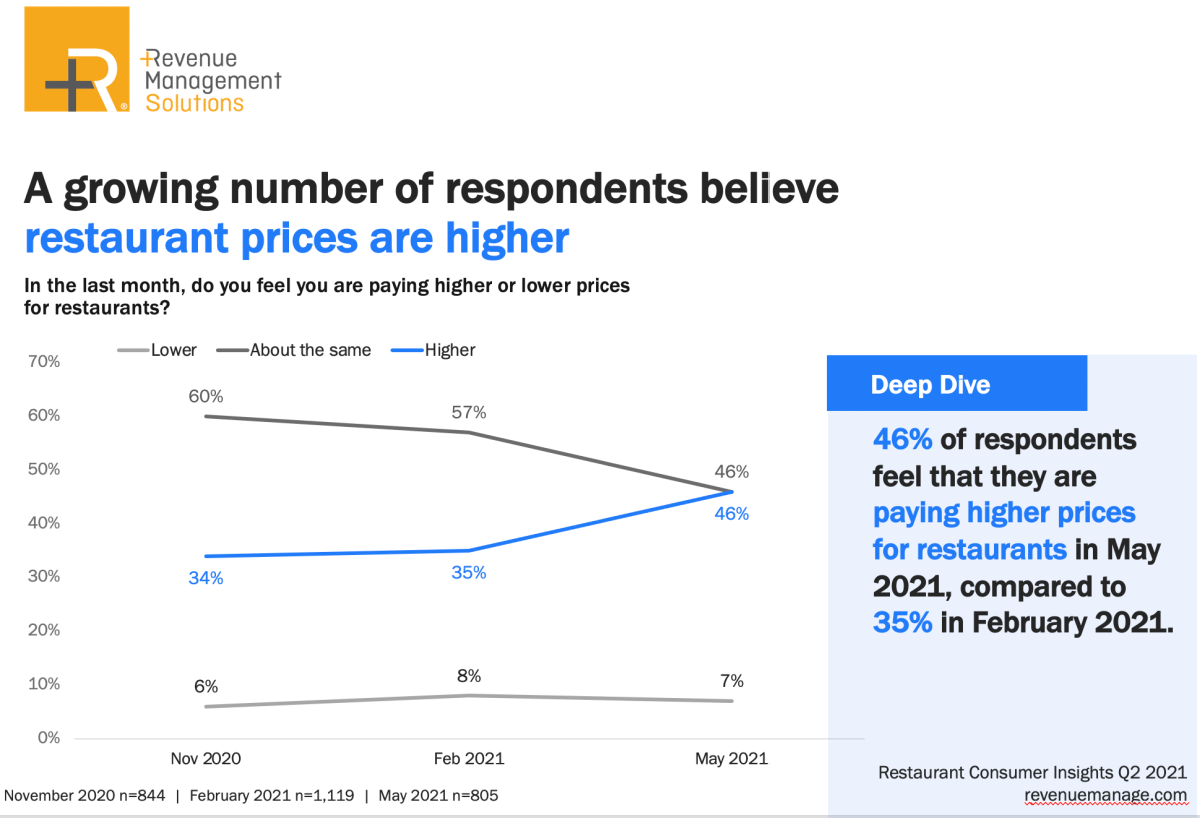
Consistently, a growing number of respondents believe restaurant prices are higher, moving from 34 percent in November 2020, to 35 percent in February 2021, to 46 percent in May.
It turns out restaurant prices ARE higher — the Bureau of Labor Statistics reports that restaurant (FAFH) prices went up 4.04 percent in May 2021, vs. grocery, which has stabilized at just 0.45 percent increases.
For more information, click here..
Customer Satisfaction Survey
Customer satisfaction with full-service and limited-service restaurants was already reeling before the pandemic turned both industries upside down. Yet, even in the face of billions of dollars in lost revenue, there’s reason to feel encouraged.
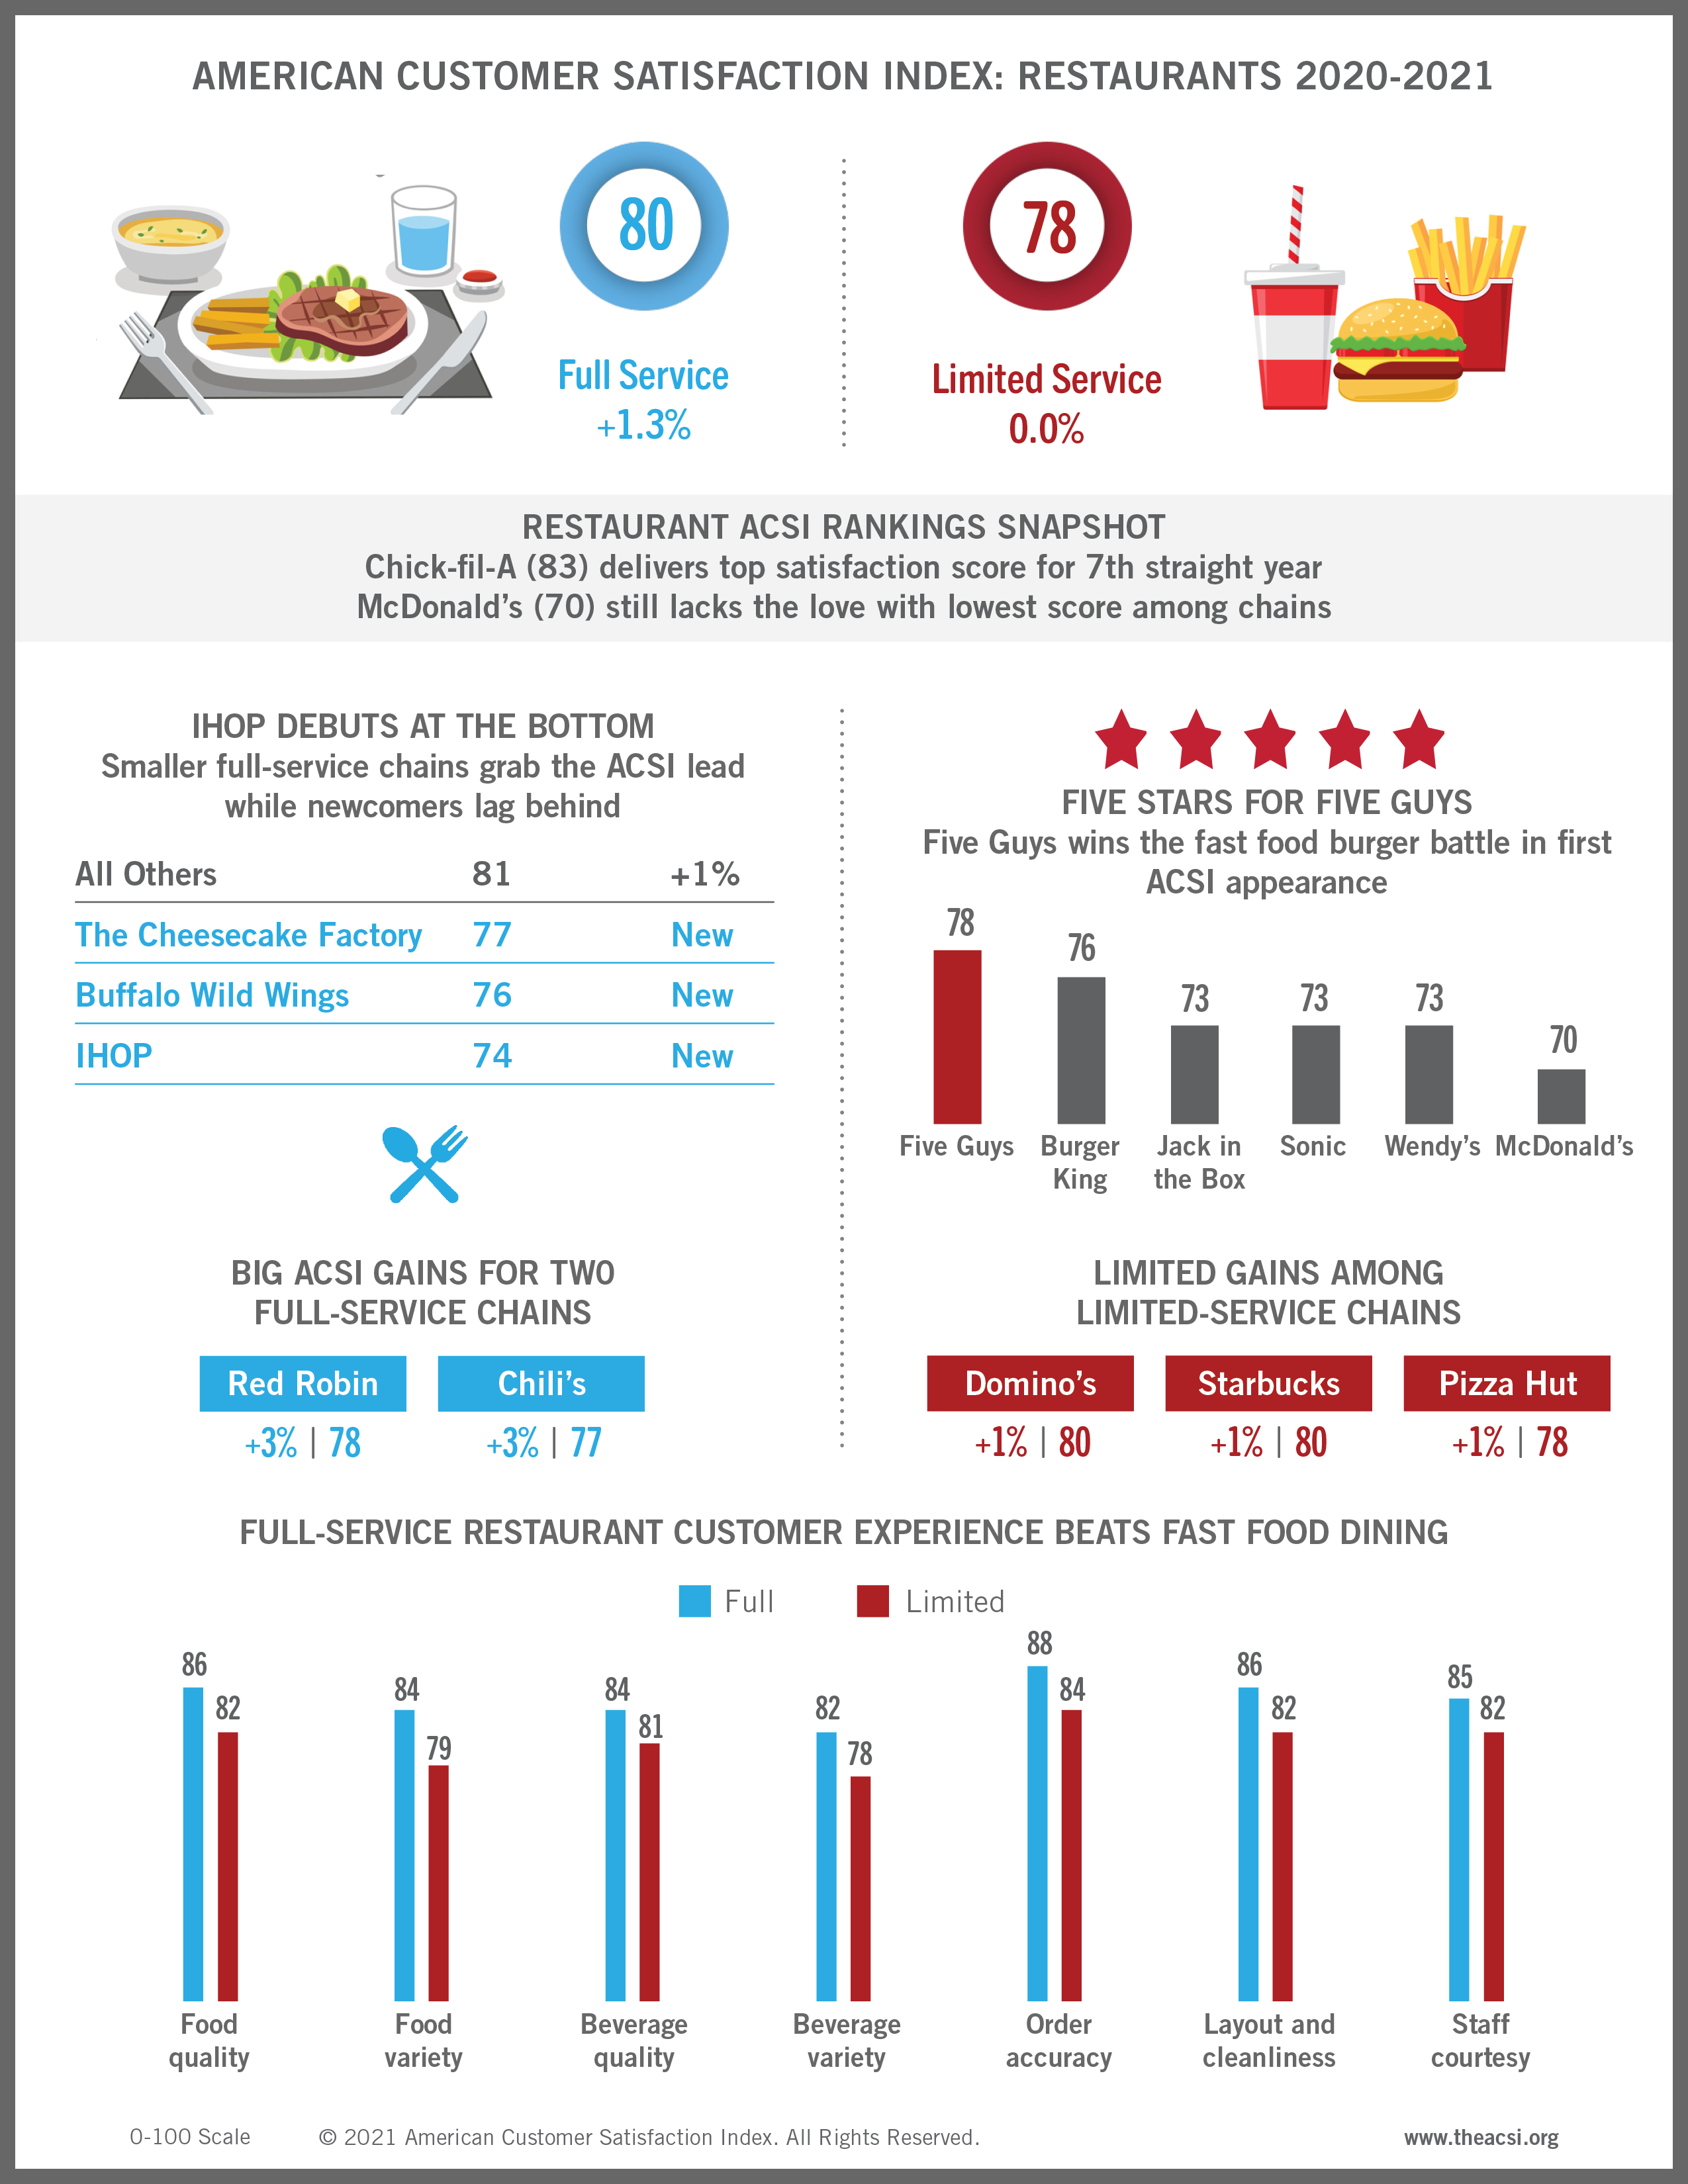
According to the American Customer Satisfaction Index (ACSI®) Restaurant Study 2020-2021, the fast food category holds steadfast for customer satisfaction while full-service restaurants rebound a point. For the Accommodation and Food Services sector overall, satisfaction dips just 0.4 percent to a score of 77.6 on the ACSI’s 0-100 scale – a much-needed stabilization following the sector’s larger decline one year ago.
The pandemic forced restaurants to rethink the way they do business or risk being shuttered. The changes they made have paid off for customers, and they’re now likely here to stay.
“People are slowly starting to enjoy sitting down at restaurants again, but don’t discount the value of convenience,” says David VanAmburg, Managing Director at the ACSI. “During the pandemic, folks got a taste for what it’s like to have food from their favorite restaurants delivered right to their door. And now that they’ve gotten used to this service, there’s no going back. Restaurants need to continue to give customers all the options they’ve become accustomed to over the last year and a half. If not, they might grab a bite somewhere else.”
Interestingly enough, despite a business model not designed to thrive when takeout and delivery become paramount, it’s full-service restaurants, not fast food outfits, that have customers ready for seconds.
Smaller full-service restaurants lead, while LongHorn Steakhouse, Olive Garden, and Texas Roadhouse hold three-way tie for second
After slipping the previous year, customer satisfaction with full-service restaurants bounces back, climbing 1.3 percent to an ACSI score of 80.
The group of smaller restaurants takes over the top spot, up 1 percent to 81. Last year’s industry leader LongHorn Steakhouse falls 1 percent into a three-way tie for second place with Olive Garden (up 1 percent) and Texas Roadhouse (unchanged) at 80.
Cracker Barrel’s decline continues, dropping 1 percent to an ACSI score of 78. The Southern-themed restaurant chain is now even with both Outback Steakhouse (unchanged) and Red Robin (up 3 percent).
Five full-service restaurants score 77, including ACSI newcomer The Cheesecake Factory, Applebee’s (unchanged), Chili’s (up 3 percent), Red Lobster (down 3 percent), and TGI Fridays (down 1 percent).
Buffalo Wild Wings debuts near the bottom of the industry, tying Denny’s (unchanged) with an ACSI score of 76. Last place, however, belongs to IHOP, which scores 74 in its first year in the study.
Chick-fil-A holds onto its fast food crown; Subway stumbles
Customer satisfaction with the limited-service (fast food) restaurant industry holds steady at 78.
Chick-fil-A tops the industry – and all restaurants – for the seventh consecutive year despite inching back 1 percent to an ACSI score of 83.
The group of smaller fast food purveyors remains unchanged at 80, tying pizza leader Domino’s, which improves 1 percent year over year. KFC (unchanged) and Starbucks (up 1 percent) are next at 79, just ahead of Panera Bread (down 1 percent) and Pizza Hut (up 1 percent) at 78. Newcomer Five Guys scores 78 as well, outperforming the other burger chains in its first ACSI appearance.
Four chains slip to a score of 77: Arby’s (down 3 percent), Chipotle Mexican Grill (down 4 percent), Dunkin’ (down 3 percent), and Papa John’s (down 1 percent).
Burger King and Little Caesars both hold steady with ACSI scores of 76, meeting Panda Express, which makes its ACSI debut. Subway goes off the rails, tumbling 5 percent to 75.
Dairy Queen premieres near the bottom of the industry with a score of 74, tying Taco Bell (unchanged). Four fast food restaurants come in just below at 73: Jack in the Box (unchanged), Popeyes (down 1 percent), Sonic (down 1 percent), and Wendy’s (down 4 percent).
McDonald’s remains in the basement of the category with a flat ACSI score of 70.
Customers prefer full-service experience over fast food dining
In terms of the customer experience, full-service restaurants have the edge. In fact, the industry overall outperforms the limited-service category across nearly all customer experience benchmarks measured by the ACSI.
Customers agree that sit-down chains are far superior to fast food outlets when it comes to restaurant layout and cleanliness (86 to 82), food quality (86 to 82), food variety (84 to 79), and staff courtesy and helpfulness (85 to 82).
Additionally, orders are more accurate (88 to 84) at full-service restaurants. These establishments offer a wider variety of beverages (82 to 78) and superior beverage quality (84 to 81).
Full-service restaurants also provide better mobile app quality (85 to 83). In terms of reliability, however, fast-food apps mirror full-service apps (both at 82).
Good Food Confidence
The Good Food Media Network released the results of its newly created Good Food Confidence Index, benchmarking attitudes and outlooks for the restaurant industry. The results were derived from the fifth annual Good Food 100 Restaurants survey that gathered insights about the business and purchasing practices of chefs and restaurants. This year’s assessment focused on the impact of COVID-19 on restaurants, their workforce and operations.
The Good Food Confidence Index found that almost 90 percent of restaurant brands expect an increase in revenues, 97 percent expect to hire employees, and 78 percent expect to increase good food purchases
“To say this was a challenging year for restaurants would be an extreme understatement. The pandemic took its toll financially, mentally and physically for so many in the restaurant and hospitality sector, and really exposed the vulnerabilities of the industry,” said Sara Brito, co-founder and president, Good Food Media Network. “As the world reopens, restaurants will reprise their role as important community beacons, reminding us why they are the heart and soul of our communities and the backbone of our local, regional, and national economy.”
Additional findings from the survey include:
Wellbeing Trumps Taste: Employee health and welfare was the highest priority for restaurants, followed by food quality and taste and supporting the local and regional economy. This is the first time in five years, that worker welfare out prioritized food quality.
Common Challenges: The most common challenges for employees were underemployment or unemployment and personal health, including mental health.
Handling Headwinds: 22 percent of respondents expect it to be either somewhat or highly likely that they have to close one or more locations in the second half of 2021.
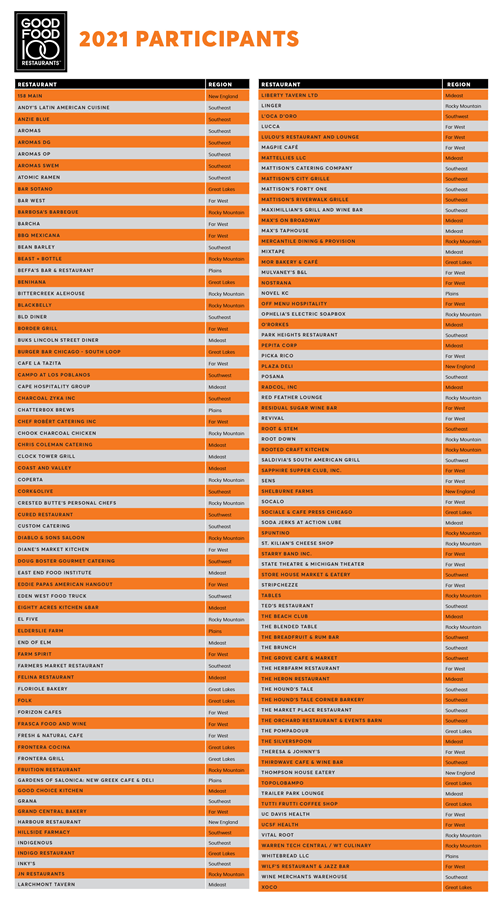
Economic Impact: The 124 participating restaurant brands in the Good Food 100 represented 196 individual restaurant locations across 33 states. Participating restaurant brands reported spending $26.7 million on food in 2020. Total food purchases had a $75.7 million economic impact on the nation.
Good Food Matters: The majority (98 percent) of the restaurants felt good food is incredibly important for their brand. Participants similarly ranked the importance of sourcing from other good food focused business.
Corresponding with the Confidence Index and COVID-19 Industry Impact analysis is the annual Good Food 100 Restaurants List, based on participating restaurants’ self-reported annual food purchasing data The Good Food 100 Restaurants analysis was conducted by the Business Research Division (BRD) of the Leeds School of Business at the University of Colorado Boulder.
Deskless Dissatisfaction
Digital workplace platform YOOBIC recently conducted a survey among 1,000 frontline employees and deskless workers to understand what are the top challenges they continue to struggle with that contribute to their job dissatisfaction. It found that “lack of career growth” is the No.1 challenge for restaurant workers, reported by 43 percent of surveyed respondents. “Lack of communication with HQ” is reported as the No.2 biggest challenge, reported by 40 percent of surveyed restaurant workers.
As restaurants race to open back up while juggling with the unprecedented labor shortage, the survey findings show that restaurant owners and employers must put together programs and benefits in place that commit to providing employees with a clear career growth roadmap –– everything from regular skills training to internal advancement opportunities and scholarship/tuition programs such as those we’ve seen from Starbucks and others. The survey findings also underscore just how disconnected everyday restaurant workers are from the corporate headquarters, directly leading to them feeling disengaged, isolated, and unmotivated.
The study also intends to find a potential solution for solving these challenges, especially considering the nature of job for restaurant workers –– unlike their desk-bound peers sitting at HQ offices, these are frontline heroes constantly on the go serving customers or busy prepping in the back kitchen. They don’t have the luxury of time or space to check emails on a computer, join a town-hall meeting with the CEO, and other programs/activities that only office workers can have access to.
As a result, YOOBIC finds that 46 percent of frontline restaurant employees report only being trained once a year or less; but 76 percent think that app-based content and mobile tools would make training easier. And 76 percent would feel more connected with the HQ if they could access company communications on a mobile device.
In addition to simply offering lucrative signing bonuses and increasing hourly wage, restaurant employers should think about how to make workers' day-to-day jobs more engaging and fulfilling, while showing them the tangible support that HQ provides in helping them grow within the company, but also their overall skills and knowledge as industry professionals. These are real benefits that will entice workers to join, and stay.
Shopper Sentiments
Shoppers are beginning to return to physical stores in significant numbers as pandemic measures lift around the world, according to a new global research report by Mood Media, the world’s leading on-premise media solutions company dedicated to elevating the Customer Experience. The report, titled “Shopper Sentiments: A June 2021 Global Mood Survey,”found that four out of five (80 percent) consumers now feel either ‘somewhat’ or ‘very comfortable’ visiting physical stores, up from 71 percent in 2020.
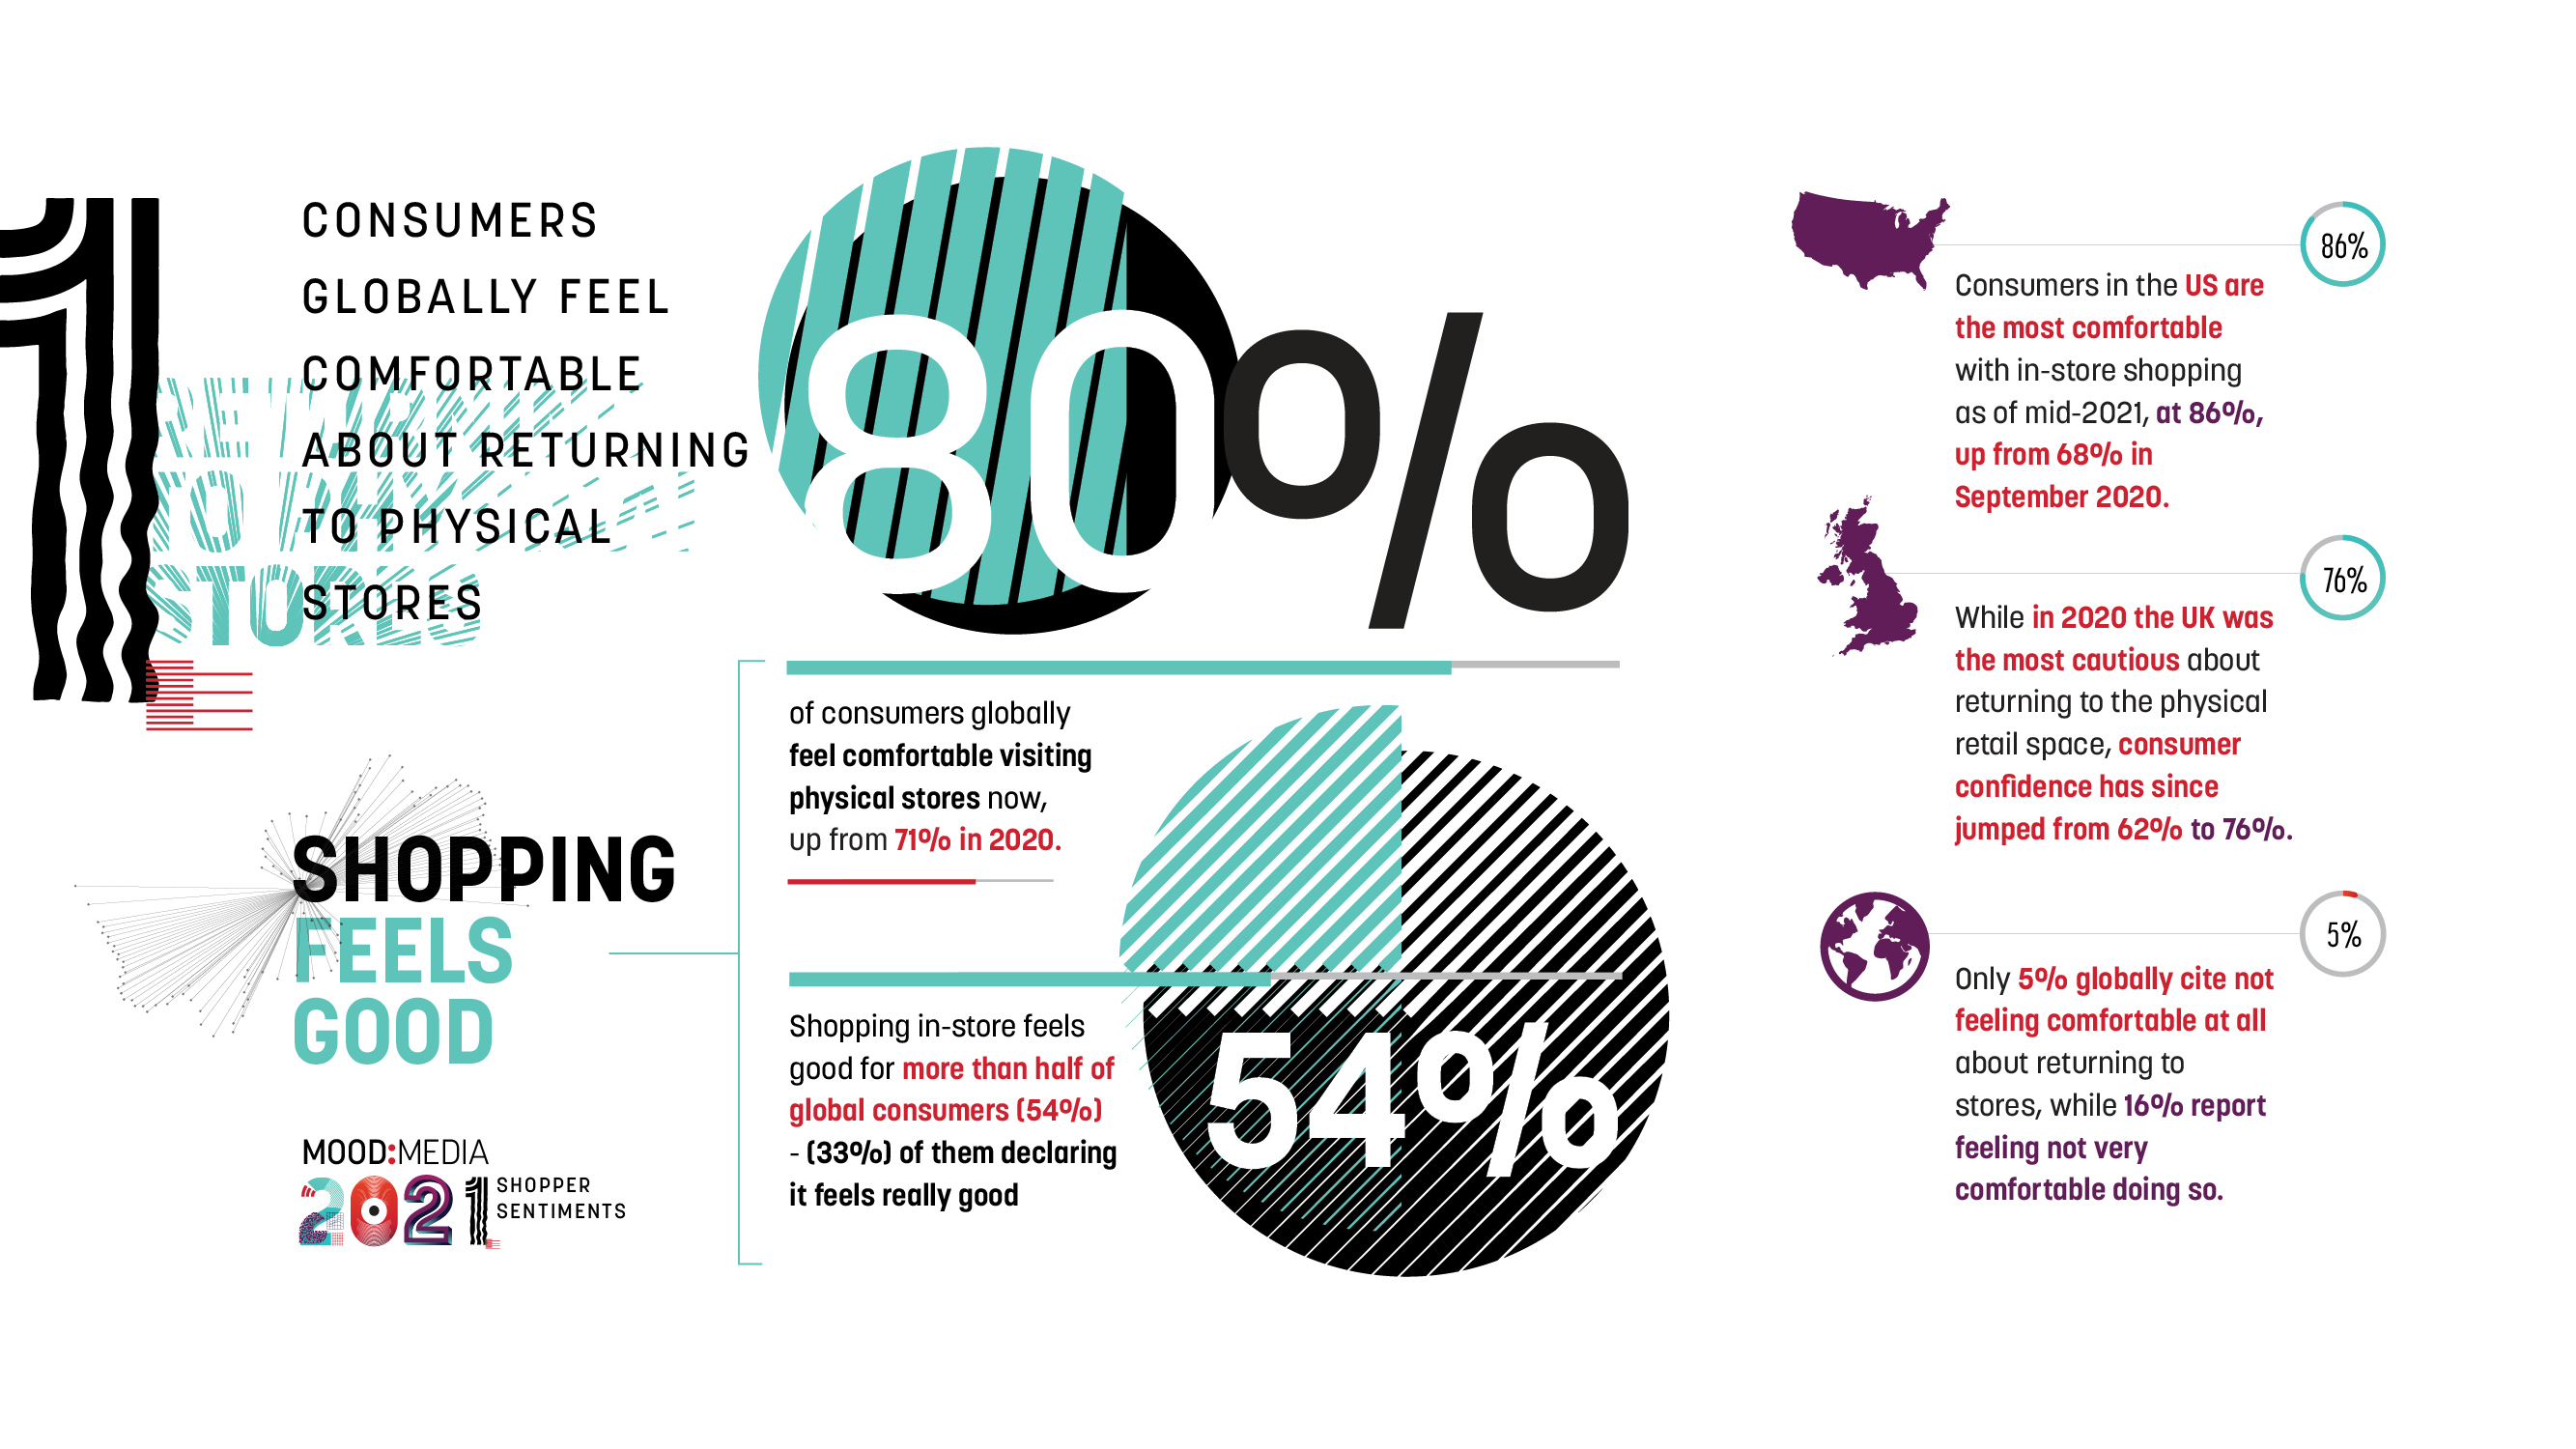
Three in five (60 percent) consumers surveyed expect their shopping habits to be back to pre-pandemic levels by or before the end of this year, while one-fifth (21 percent) of respondents report their shopping habits have already returned to pre-pandemic levels. These encouraging findings and predictions for physical stores are bolstered by the fact that only 5 percent of respondents across the U.S., UK, China and France reported not feeling ‘comfortable at all’ about returning to stores.
Scott Moore, Global Chief Marketing Officer (CMO) at Mood Media, said: “We’re experiencing a healthy buzz as shops reopen to a ‘new normal’ throughout the world. Consumers are eager to get back into stores to experience the joy of shopping again. This new study validates what we are seeing and hearing every day – both online and offline play an important role in retail, oftentimes in harmony with one another. That balance is now returning with solid foot traffic in shops around the world.”
A follow-up to Mood Media’s Shopper Sentiments: A September 2020 Global Mood Survey, this new study was carried out by Censuswide and surveyed more than 8,000 consumers across four major markets – the U.S., UK, China and France.
Revealing what global shoppers have missed most about the physical shopping experience during lockdown – largely pointing to benefits that don’t exist when shopping online – nearly half (45 percent) said it was the experience of ‘touching and trying on’ items on the spot that they missed most when stores were closed.
The fun and social experience of shopping with friends and significant others is the second most missed aspect of physical shopping (35 percent), tied with the opportunity to bring the purchase home immediately at 35 percent as well.
Consumers have also enjoyed the merging of physical and digital, with a third (33 percent) of them citing plans to continue using Click and Collect/BOPIS (Buy Online, Pickup In-Store) services beyond the pandemic, with U.S. consumers above the global average at 38 percent.
Globally, most consumers (84 percent) say there is no significant difference in the amount of money they are currently spending compared to before the pandemic.
However, after over 15 months of global uncertainty, the data also indicates that consumer spending overall is on the rise. The percentage of respondents reporting an uptick in their spending compared to before the pandemic has increased from 23 percent in September 2020 to 29 percent in June 2021. The percentage of consumers reporting they are spending less has also gone down, from 38 percent in 2020 to 25 percent today, while those citing spending the same as before the pandemic has increased from 40 percent to 46 percent.
Moore added: “The pandemic placed pressure on stores to innovate at a faster pace, leading to an accelerated ‘phygital’ evolution which merges the physical and digital shopping experience. The survey highlights key phygital trends that will be a focus for retailers and the customer journey beyond the here and now. Consumers have told us they want Click and Collect and Buy Online, Pick-Up In-Store options to continue well beyond the pandemic. And in China, we’re seeing longevity in the future of virtual try-ons and QR codes.
“The figures generally show positive sentiment across all four countries surveyed. While some reservations remain with regard to safety measures, people are generally voting with their feet and their wallets. We’re delighted that we appear to be approaching the end of a fairly grim 15 months, and life seems to be improving for the retail sector as a whole.”
For a full overview of Mood Media’s latest survey findings and to download the booklet, click here.
Paytronix Systems, Inc., the most advanced digital guest experience platform, today published the latest report in its ongoing series “Delivering on Restaurant Rewards,” a PYMNTS and Paytronix collaboration, which finds that 47 percent of restaurant customers use at least one loyalty program. The biggest growth is in those ordering from quick service restaurants (QSR), while table service restaurants are missing out on the opportunity to monetize 53 million customers because of their lack of loyalty programs.
Download the full report, Delivering on Restaurant Rewards: Sit-Down Restaurants Miss Chance To Monetize 53 Million Customers
Delivery on Restaurant Rewards
This issue of Delivering on Restaurant Rewards notes that between January 22 and April 22, 2021, the share of consumers using restaurant loyalty programs increased 12 percent. In fact, 42 percent of all restaurant customers had been using at least one restaurant’s loyalty program on January 22, and that figure increased to 47 percent by April 2
Top insights from this edition of Delivering on Restaurant Rewards include:
QSR Growth — The increase in restaurant reward program usage is most pronounced among consumers who order from quick service restaurants (QSR). Twenty-four percent more chain QSR customers reported using at least one restaurant’s loyalty program on April 22 than did on January 22.
Top Loyalty Users — Millennial and bridge millennial restaurant customers use more loyalty programs than the rest. They are also signing up for new loyalty programs faster than all other age groups.
Loyalty Drives Spend — Demand for restaurant loyalty programs soars after the first sign-up. Fifty-seven percent of consumers who already use at least one restaurant’s loyalty program would spend more on food orders from other restaurants if the latter offered loyalty programs as well.
“Consumers who already use loyalty programs are eager to sign up for more. Fifty-seven percent of restaurant customers who are signed up for at least one restaurant’s loyalty program would be willing to spend more on food orders from other restaurants if they could use loyalty and rewards options.” – Delivering on Restaurant Rewards.
The latest edition of Delivering On Restaurant Rewards, a PYMNTS and Paytronix collaboration, steps back to examine how consumers’ interest in and usage of restaurant loyalty programs have evolved since the onset of tracking their restaurant ordering habits in September 2020.Paytronix and PYMNTS surveyed a census-balanced panel of 2,238 consumers between April 14 and April 22 about how they placed, paid for and obtained their restaurant orders and which features might encourage them to spend more. Their answers were then then compared to those provided by the other 18,898 consumers surveyed since September 2020 to discover how what consumers want from their frequented restaurants continues to shift as the end of the ongoing Covid crisis draws nearer.
Our New Routines
The Coca-Cola Company recently identified four macro forces that are driving the new routines in our world. The attached document details those forces, defines how they impact businesses and outlines 15 new and emerging trends that these forces have shaped.
Coca-Cola originally presented these actionable insights to its retail and foodservice customers as part of the company’s commitment to be its customers’ best business partner as well as their best beverage provider.
De-urbanization: Since 2000, population growth in large suburban counties has increased. As a result, people enjoy less crowded areas and lower living costs for more space.
Urban and suburban divide: Urban and suburban citizens are increasingly socially, politically and culturally divided due to factors like migration, employment and income. 11.7 million people live in rural areas without access to healthy food retail but have the market demands to support supermarket investments.
Retailer takeaway: Expand reach to rural and suburban residences and explore impact of growing geographic divide on shopping and consumption patterns.
The coronavirus pandemic exposed weaknesses in how prepared we were, as a society and personally, for a public health crisis.
Heightened preparedness: Shoppers took extreme measures to over-prepare so they’re ready for whatever the future holds. 60 percent of Americans have said that the pandemic will change the way they shop, even after it’s over, and most indicated they have stockpiled on items like toilet paper and meat..
Hyper-hygiene: Hygiene will be a lasting concern and expectation for most when entering public spaces. People are demanding that businesses accommodate these new cleanliness needs with sanitation and tracing protocols of their own.
Retailer takeaway: Communicate new health and safety protocols across the supply chain.
Although increased time at home has made internet accessibility a requirement to thrive in this new digital age, not all Americans are equipped to make the switch, and new societal factions may emerge as a result of the split.
Mandatory connectivity: Internet usage has increasingly grown over the years, but the pandemic forced true reliance, moving nearly all daily activities online. The forced dependency also established new digital preferences for both work and play that many claim will stay for the foreseeable future.
Digital divisions: 19 million Americans lack fixed access to the internet, one in four of which are in rural areas. These citizens may miss out on some opportunities afforded to those with a reliable connection.
Retailer takeaway: Digital-only and digital-first solutions are here to stay, but don’t alienate key consumer groups.
How Customers Connect with Brands
Software AG has new research, revealing what Americans are looking for in their experiences with brands and businesses, as COVID-19 restrictions lift. Based on a survey of 1,000 U.S.-based consumers aged 18 and older, findings indicate that after a year+ of navigating the pandemic, consumers’ expectations for experiences have grown. They want faster online delivery, smaller in-person lines and crowds, as well as added conveniences that help to connect digital and physical environments.
More than half (55 percent) of those surveyed said they have a higher expectation for in-person experiences (e.g., sporting events, concerts, conferences, etc.) than they have in the past. Additionally, over a third (34 percent) said they have higher expectations than they did a year ago for online retail purchases to be delivered on time – with 70 percent going so far to say that they would choose a retailer based solely on the speed of their delivery. These are the new realities after a year that has changed consumer habits and where organizations have doubled down on digital investment.
Sanjay Brahmawar, CEO of Software AG, commented: “Businesses have long had the opportunity to digitally transform, but the pandemic expedited this seemingly overnight. Now that consumers know what is possible, they not only expect the enhancements and conveniences they see today, but they want more. Integration, IoT and business transformation software make this all possible, whether it’s expediting supply chain processes for delivery, incorporating smart sensors to manage lines and crowds, or integrating physical and digital channels for seamless touchpoints. The future of customer experiences has arrived – and the organizations that focus on fundamental modernization over short-term cosmetic changes will come out on top.”
According to the Software AG survey, consumers have grown accustomed to digital capabilities integrated into traditionally physical environments. Not only did many respondents say they will continue to look for these enhanced services, but they hope to see others in the future as well. Findings across experience type include the following:
- Large-scale in-person events (concerts, sporting events, conferences, etc.)
- 76 percent of consumers would like to see at least one of the following implemented at a large-scale in-person event in the future:
- Mobile-enabled ticketing / check-in (49 percent)
- Mobile-enabled payment (38 percent)
- Wait estimates/crowd management alerts (restroom, concierge lines, merchandise, entry point, etc.) (38 percent)
- Concierge experience from their seat (mobile-enabled ordering for food/beverage) (34 percent)
- Mobile-enabled interactive activities (contests, polling, voting, etc.) (27 percent)
Restaurants/dining
- 73 percent of respondents believe their restaurant experience (dining or takeout) is enhanced with a mobile component and 72 percent plan to use at least one of the following services, even after COVID-19 restrictions have been lifted:
- Mobile-enabled ordering (54 percent)
- Mobile-enabled payment (38 percent)
- Mobile-enabled reservations/booking (38 percent)
Things to Do Awards
Tripadvisor® announced the winners of its 2021 Travelers’ Choice® “Best of the Best” Things to Do Awards. Previously called the Travelers’ Choice Awards for Experiences, the revamped Things to Do Awards have been broadened to recognize the best activities listed on Tripadvisor, so travelers across the globe can look no further for inspiration to make that all important next vacation exceptional. Tripadvisor expanded the awards across a dozen subcategories, from Nature and Hiking to Water Adventures to Out of the Ordinary Experiences, reflecting activities that have been hot since the start of the pandemic. Tripadvisor’s vast inventory of things to do – with nearly 400,000 bookable activities – is the go-to source for anyone looking to elevate their travels.
The No. 1 Experience in the world for 2021 is a Jet Ski Tour of Dubai: Burj Al Arab, Dubai Marina, Atlantis, Palm & Burj Khalifa. Travelers are loving soaking in the stunning Dubai skyline with the thrill of a jet ski ride, and ample photo-ops. Here in the U.S., it’s another water adventure topping travelers’ list; the Clear Kayak Tour of Shell Key Preserve and Tampa Bay Area is the No. 1 Experience in the U.S. On this tour, travelers can get a window seat to the gorgeous waters and wildlife of Florida in a crystal-clear kayak.
Trending Things for 2021
Tripadvisor is awarding Travelers’ Choice to 530 Things to Do this year. The activities cracking the list for 2021 are largely outdoor and water-based, not surprising in light of the outdoors craze prevailing throughout the pandemic. Winners also include more than your traditional guided city walking tours, with things like a husky safari in Finland, French wine and cheese tasting in Paris, and a private boat through the crystal blue lagoon of Malta ranking among travelers' favorites.
In addition to world and country-level winners, this year Tripadvisor is also ranking the best Things to Do in 10 major cities around the world, inclusive of experiences, tours, activities and attractions. It’s the first time Tripadvisor has combined attractions and bookable experiences into one major award category, giving travelers a full picture of the best things to do in popular cities globally – according to those who’ve visited.
For 2021, Tripadvisor is awarding the Best of the Best Things to Do across 12 subcategories:
Top Overall Experiences, inclusive of experiences, tours and activities
No. 1 in the world: Jet Ski Tour of Dubai: Burj Al Arab, Dubai Marina, Atlantis, Palm & Burj Khalifa – Dubai, UAE
Best Things to Do in 10 cities around the world, inclusive of experiences and attractions
No. 1 in the world: Hang gliding Experience Rotorfly – Rio de Janeiro, Brazil
No. 1 in the world: Undiscovered Charleston: Half Day Food, Wine & History Tour with Cooking Class – Charleston, S.C.
No. 1 in the world: Ziplining Forest Adventure – The Original Canopy Tour Rotorua – Rotorua, New Zealand
No. 1 in the world: Jet Ski Tour of Dubai: Burj Al Arab, Dubai Marina, Atlantis, Palm & Burj Khalifa – Dubai, UAE
Out of the Ordinary Experiences
No. 1 in the world: Heli Hike Fox Glacier – Fox Glacier, New Zealand
No. 1 in the world: 2 Hour Lisbon Sunset and Wine Sailing Tour – Lisbon, Portugal
No. 1 in the world: Wine Sampler Tour – Queenstown, New Zealand
No. 1 in the world: Red Rock Canyon Self-Guided Electric Bike Tour, Las Vegas, Nev.
No. 1 in the world: 3-Days Discovery Of Angkor, Waterfalls, Floating Village and Banteay Srei temple – Siem Reap, Cambodia
No. 1 in the world: Exciting Upper Pigeon Smoky Mountains Rafting Trip – Hartford, Tenn.
Top 10 Experiences in the U.S. for 2021
Clear Kayak Tour of Shell Key Preserve and Tampa Bay Area – Tierra Verde, Fla.
Get a window seat to the waters of Florida in a crystal-clear kayak. This immersive perspective on the gorgeous wildlife and nature found in these waters has left travelers calling it the “BEST experience in my life.”
Fins Course Scenic Zipline Tour – Colorado Springs, Colo.
Enjoy an active day immersed in nature on this ziplining tour of the Seven Falls canyon, soaking up sweeping views of the scenic surroundings from heights of up to 1,800 feet.
Swim with the Manatees Includes In-Water Guide and Photographer – Crystal River, Fla.
Swimming with manatees in Crystal River provides a peak experience with these gentle giants in their natural habitat. Your guide shares detailed commentary about Florida’s ecosystem, and snaps underwater photos for your group.
Classic Waco Tour: Best Sites & TV highlights in Waco – Waco, Texas
Get a taste of the trending city (which some say Chip and Joanna Gaines put on the map) to learn about its rich history and explore gorgeous neighborhoods, including those seen on T.V. Hello Magnolia Market!
Top Rated Wine and Shine Walking Tour – Gatlinburg, Tenn.
Taste your way through the streets of Gatlinburg on a moonshine walking tour. The spirit that was once produced in secret is now offered at refined distilleries around the town.
Moab Xtreme 3-Hour Experience – Moab, Utah
Go further and cover more ground than the typical Jeep tours. This “Xtreme” trip includes all the obstacles and trails you won’t see elsewhere.
Red Rock Canyon Electric Bike Half-Day Tour – Las Vegas, Nev.
An electric bike tour of Red Rock Canyon National Conservation Area transforms a 13-mile loop from a challenging prospect to a fun way to explore the desert landscape, cruising to scenic vista points and red-rock scenery.
Private Boating On The Hurricane Deck Boat – Clearwater Beach – Clearwater, Fla.
Swap noisy and crowded group boat trips for a more intimate alternative – a private customized boat tour. Look out for dolphins and local marine life, visit pristine beaches, and swim in the Gulf of Mexico.
Emerald Cave Kayak Tour – Las Vegas, Nev.
Experience the Colorado River’s majestic Emerald Cave on a scenic kayaking tour led by a guide pointing out wildlife and gorgeous geological features.
Guided Hike through Peek-a-Boo Slot Canyon – Kanab, Utah
The quiet serenity of beautiful colored Navajo Sandstone rocks that have taken millions of years to form will take your breath away and leave you wanting more
Foot Traffic Analysis
The latest report by foot traffic analytics firm Placer.ai, titled Placer Bytes – Chipotle and Darden analyzes data from the restaurant sector and finds that two companies in the space — Chipotle and Darden Restaurants — are seeing uneven recoveries. The good news is that customers are, by and large, heading back to restaurants as the pandemic wanes and vaccination rates increase. But it hasn’t been a smooth or even recovery for either company.
As for a short appetizer? Chipotle saw foot traffic increase in a big way in recent months — in March, it was down 4.5 percent overall (compared to March 2019) after being down 22.7 percent in February. That’s a considerable increase, but since then, it’s been a rocky road. And for Darden’s portfolio of brands (like Olive Garden, Yard House, LongHorn Steakhouse, and Cheddar’s Scratch Kitchen), one is a clear standout — while the others are still playing catch-up.
The full report can be found here.
Report highlights:
Darden’s standout
LongHorn Steakhouse is beating Darden’s other chains, and handily. In May, foot traffic was up 14.2 percent compared to May 2019, while the other three brands were still underwater. Olive Garden was the closest to pre-pandemic levels, with visits down 6 percent during the month.
Chipotle’s…comeback?
As noted, there was a stark increase in visits to Chipotle between February and March. But since then, foot traffic has been on the slide. Compared to 2019’s numbers, visits were down 4.5 percent in March, 6.5 percent in April, and 8.1 percent in May.
An appetizing summer on tap?
With pandemic-related business restrictions being rescinded around the country, there’s reason to think that Darden’s chains and Chipotle could see a surge in visits in coming weeks and months — and that’s especially true in states like New York and California.
State of Repairs
86 Repairs released its annual State of Repairs Report, a comprehensive look at industry-wide trends and data-backed insights pulled directly from a sample of more than 500 customer locations and their service history throughout the 2020 calendar year.
From manufacturer reliability and service provider performance to top equipment incidents and average cost per service, the report details never-before-seen insights to help restaurant operators take actionable steps for strategic R&M planning.
“Equipment repairs and maintenance cost the restaurant industry $26 billion annually. It’s a huge line item on the P&L that can be controlled,” said Daniel Estrada, co-founder and CEO of 86 Repairs. “By taking a holistic look at repair trends and spending, we can make smart recommendations for operators on how to manage their equipment, proactively approach maintenance, and save time and money on repairs.”
Highlights from the State of Repairs Report include:
Top 10 Incident Requests by Equipment Type: 31.88 percent of all incidents fall under the cold-side category. A sample of requests from August 2020 included:
HVAC – 19.51 percent
Plumbing – 17.53 percent
Cold-Side Infrastructure – 9.88 percent
Walk-In Cooler: 9.88 percent
Handywork – 8.89 percent
Gas Fryer – 8.64 percent
Electrical – 8.40 percent
Ice Maker – 6.17 percent
Prep Table – 5.93 percent
Reach-In Refrigerator – 5.19 percent
Chill Out: No matter the restaurant type, cold-side service repairs were common and costly, with the average incident running $765.50. Markets affect costs: Florida ($678.47); Illinois ($844.01); Texas ($1,051.00); North Carolina ($746.41).
Performance Matters: There was a significant difference in the Mean Time to Resolution (MTTR) between the best and worst-performing service providers. MTTR is a key indicator for evaluating the quality of a service provider—the shorter the MTTR, the shorter an operator’s downtime. Top 25 percent performers respond 6 percent faster, cost 13 percent less, and solve an incident 222 percent faster.
Cost Savings: Between hard costs and time, the sample set saved a total of $949,859.57 utilizing 86 Repairs. The importance of tracking repairs was underscored by the fact that during COVID-19, when restaurants had to cut back on nearly everything, they still kept their contracts with 86 Repairs as a proven cost-savings tool.
Prevention is Key: If it isn’t broken, eventually you’re going to have to fix it. Investing in a preventative maintenance program will skip the hassle of expensive last-minute breakdowns and reduce operating costs associated with reactive, in-time repairs. A solid program can save up to 30 percent on energy costs alone
“Broken refrigerators and ice machines are going to happen. It’s the cost of doing business. Having actionable knowledge of when, why, and how to fix or replace equipment gives restaurants a leg up,” added Estrada. “Operators are already leaning into technology and automation to streamline the rest of their business. Our data can help them be more effective when it comes to managing and paying for their equipment—directly affecting their bottom-line.”
Favorite QSRs
The COVID-19 pandemic has fundamentally changed the world as we know it. For the QSR industry, the most powerful success metric has changed. Why guests chose one restaurant over another has transformed into a dynamic scenario defined by visit satisfaction, and brand trust, each playing off the other across the lifetime of the consumer’s engagement. The competitive benchmark study from Market Force examines these changes surveying why customers prefer one brand over another, looking at factors such as service, trust, food quality, value, and technology. There are clear winners and losers in each category highlighted in the findings below.
Burgers: In-N-Out is a Fan Favorite, McDonald’s Lands at the Bottom
In-N-Out fans are known for their fierce loyalty and – in many cases – their pleas for this regional burger chain to bring a location to their town. The noted California-based chain ranked No. 1 with 71 percent.3, followed by Five Guys Burgers and Fries, and Culvers. On the flip side, Carl’s Jr., Burger King, and McDonald’s received the lowest scores among the 11 chains studied. The study found Five Guys Burgers and Fries rated highest on food quality with 73.6 percent demonstrating their strong focus on execution in each restaurant.
Chicken: Chick-fil-A and Raising Cane’s Excel in Consumer Satisfaction and Loyalty
The battle between quick-service restaurants for chicken sandwich sales has yet to lose any steam entering 2021. Chick-fil-A snagged the top spot in Market Force’s 2021 QSR study with 76 percent, just slightly higher than Raising Cane’s, which earned 72 percent. Category-leader Chick-fil-A received the highest scores in every category. Raising Cane’s was the leader in overall satisfaction. Recognized with a 2021 Glassdoor Employees’ Choice Award, Raising Cane’s received strong scores in staff friendliness and helpfulness.
Pizza: Carry Out Chain Little Caesars Takes the Pie
The ease and affordability of pizza made it a pandemic staple for many families and a rare bright spot for the QSR industry as a whole. Little Caesars, with its Reserve-N-Ready pizza, is leading in food quality for consumers, earning it the No. 1 spot with 54 percent. “Reserve-N-Ready,” allows customers to order directly from the mobile app or website and when the order is ready, guests receive a notification, swing by the store, and pick up the pizza without any direct contact. Consumers ranked Papa John’s a favorite for overall service (55 percent), while Pizza Hut’s staff came out on top as the most friendly (52 percent) in this highly competitive category.
Mexican: Chipotle and Del Taco Take the Lead
In the great Mexican grill showdown, Chipotle, known for its highly customizable burritos and bowls, takes the title of consumer favorite for overall satisfaction. With Del Taco and El Pollo Loco, the nation’s leading firegrilled chicken restaurant chain, following close behind. El Pollo Loco’s menu offerings were a standout with diners, who ranked it first in the food quality category. Notably El Pollo Loco has also increased accessibility to better-for-you food options. Del Taco, the nation’s second-largest Mexican quick-service restaurant chain, led the pack for fast and friendly service.
Sandwiches: Consumers Favor Jersey Mike’s and Firehouse for Sandwiches
The sandwich wars continued with top brands competing intensely for the overall share of stomachs. Jersey Mike’s and Firehouse Subs are far-and-away the nation’s preferred sandwich chains, according to Market Force’s study. Guests can place takeout orders in-store or for pickup through the website or the Jersey Mike’s app making it a convenient choice for its digital experience. Both brands ranked 80 percent on overall satisfaction. Jimmy John’s and Panera also ranked high on the list.
To see the entire study results along with additional categories download the competitive benchmark study here.